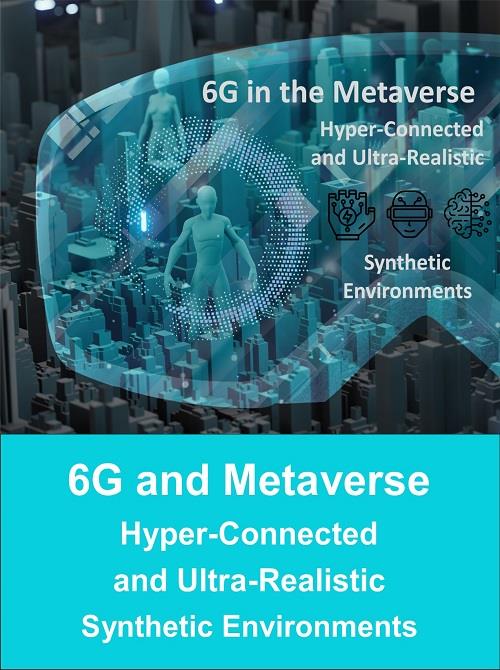
Sixth Generation Wireless to act as Major Catalyst for Metaverse Adoption and Innovation
Speak directly to the analyst to clarify any post sales queries you may have.
The combination of sixth generation (6G) communications and the Metaverse will facilitate the ability to establish ultra-realistic synthetic environments. 6G will provide extremely high bandwidth and hyper-connectivity as anytime, anywhere connections will facilitate persistent virtual worlds and physical-to-cyber interactions. Digital twin technology and smart surfaces in the material world will also support real-to-digital interchange.
This research assesses the market opportunity for Metaverse vendors and ancillary services providers including infrastructure, devices, software, and supporting services. This includes qualitative and quantitative analysis of the Metaverse market and related segments from 2022 to 2027.
The research also assesses 6G market commercialization including opportunities for infrastructure development and equipment deployment as well as a realization of applications and services. It also analyzes 6G market use cases by industry vertical. It provides 6G market sizing for 2022 through 2030, with the lower end of the range focused primarily on technology development, and the latter end of the range focused on 6G market commercialization.
This research also evaluates digital twinning technology, solutions, use cases, and leading company efforts in terms of R&D and early deployments. It assesses the digital twin product and service ecosystem including application development and operations. This includes consideration of use cases by industry vertical.
This research also evaluates the smart surfaces market including technologies, materials, solutions and applications. It assesses vendor strategies, product and service offerings. It also analyzes the future impact of smart surfaces upon key industry verticals including telecommunications, where it will play a critical role in support of radio access networks for 5G, 6G and beyond.
With the purchase of this report at the Multi-user License or greater level, you will have access to one hour with an expert analyst who will help you link key findings in the report to the business issues you're addressing. This will need to be used within three months of purchase.
This report also includes a complimentary Excel file with data from the report for purchasers at the Site License or greater level.
Table of Contents
Metaverse Market by Technologies, Platforms, Solutions and Applications in Industry Verticals1. Executive Summary
2.1.1 Conceptual Framework: Product/Service/Place/Moment
2.1.2 Technology Pillars/Layers
2.1.3 Key Features
2.2 Metaverse Building Blocks
2.2.1 Building Block 1: Infrastructure
2.2.2 Building Block 2: Virtualization Engine
2.2.3 Building Block 3: Interface and Access
2.2.4 Building Block 4: User Experience and Use Cases
2.2.5 Building Block 5: Tools and Standards
2.3 Metaverse Types
2.3.1 Augmented Reality
2.3.2 Virtual Reality
2.3.3 Lifelogging
2.3.4 Mirrored Worlds
2.4 Metaverse Development Timeline
2.4.1 Today: Virtual Reality as a Digital Escape
2.4.2 Near Term: AR to Enhance Human Experience
2.4.3 Longer Term: BCI as Final Platform
2.5 Metaverse Rational for Business
2.6 Web 3 and the Metaverse
2.7 Market Dynamic Analysis
2.7.1 Growth Driver Analysis
2.7.2 Market Challenge Analysis
2.7.3 Market Opportunity Analysis
2.8 Pandemic a Market Driver for the Metaverse
2.9 Value Chain Analysis
2.9.1 Hardware and Equipment Providers
2.9.2 Infrastructure Solution Providers
2.9.3 Software Solution Providers
2.9.4 Platform Providers
2.9.5 Content Providers
2.9.6 AI Companies
2.9.7 Enabling Technology Providers
2.10 Industry Development
2.10.1 Deal, Acquisition, Investment, and Alliance Analysis
2.10.2 Technology Collaboration Analysis
3.1.1 Blockchain
3.1.2 Virtual and Augmented Reality
3.1.3 Mixed Reality
3.1.4 Brain-Computer Interfaces
3.2 Enabling Technology Analysis
3.2.1 NFTs
3.2.2 Artificial Intelligence
3.2.3 Internet and 5G Network
3.2.4 3D Modelling
3.2.5 Edge Computing
3.2.6 Digital Twin Technology and Solutions
3.2.7 Cryptocurrency
3.3 Metaverse Hardware/Device Analysis
3.3.1 Displays
3.3.2 Extended Reality Hardware
3.3.2.1 Haptic Sensors and Devices
3.3.2.2 Omni Treadmills
3.3.2.3 Smart Glasses
3.3.3 AR/VR Headsets
3.4 Metaverse Software: Asset Creation Tool vs. Programming Engines
3.5 Metaverse Platform Analysis
3.5.1 Desktop Platform
3.5.2 Mobile Platform
3.5.3 Console Platform
3.5.4 Headsets/Wearables Platform
3.6 Metaverse Sales Channel: Direct vs. Distribution
3.7 Metaverse Application Analysis
3.7.1 Financial Institutes
3.7.2 Retail and Fashion
3.7.3 Media and Entertainment
3.7.4 Real Estate
3.7.5 Education
3.7.6 Aerospace
3.7.7 Automotive
3.7.8 Healthcare
3.7.9 Manufacturing
3.7.10 Military
3.8 Metaverse Ecosystem
4.2 Apple Inc.
4.3 Google
4.4 Tencent Holdings
4.5 ByteDance Ltd.
4.6 NetEase Inc.
4.7 Nvidia Corporation
4.8 Unity Technologies Inc.
4.9 Lilith Games
4.10 Nextech AR Solution Corp.
4.11 Active Theory
4.12 Decentraland
4.13 Microsoft Corporation
4.14 Globant
4.15 Alibaba Cloud
4.16 Magic Leap Inc.
4.17 Queppelin
4.18 HoYoverse (miHoYo)
4.19 ZQGame
4.20 Sony Corporation
4.21 GoMeta
4.22 Niantic
4.23 Valve
4.24 Baidu
4.25 Somnium Space
4.26 Binance
4.27 Walmart
4.28 Nike Inc
4.29 Gap Inc
4.30 Verizon
4.31 Hulu LLC
4.32 Netflix
4.33 Adidas
4.34 Atari Inc.
4.35 HyperVerse
4.36 Nakamoto Games
4.37 The Sandbox
4.38 Roblox Corporation
4.39 Epic Games Inc.
4.40 Bloktopia
4.41 Cryptovoxels
4.42 Metahero
4.43 Star Atlas
4.44 Bolly Heroes
4.45 OneRare
4.46 LOKA
4.47 Cope Studio
4.48 Zippy
4.49 NextMeet
4.50 ZQGame
4.51 Larva Labs (Yuga Labs)
4.52 Sky Mavis
4.53 Sorare
4.54 Rarible
4.55 LeewayHertz
5.1.1 Global Metaverse Market by Type
5.1.1.1 Global Metaverse Market by Hardware Type
5.1.1.1.1 Global Metaverse Market by XR Hardware Type
5.1.1.2 Global Metaverse Market by Software Type
5.1.1.3 Global Metaverse Market by Service Type
5.1.1.3.1 Global Metaverse Market by Professional Service Type
5.1.2 Global Metaverse Market by Platform Type
5.1.3 Global Metaverse Market by Technology Type
5.1.4 Global Metaverse Market by Solution Type
5.1.5 Global Metaverse Market by Application Type
5.1.6 Global Metaverse Market by Industry Vertical
5.1.7 Global Metaverse Market by Sales Channel
5.1.8 Global Metaverse NFT Market
5.1.9 Metaverse Market by Region
5.1.9.1 North America Metaverse Market: Hardware, Software, Service, Platform, Technology, Solution, Application, Industry Vertical, Sales Channel, NFT, and Country
5.1.9.2 Europe Metaverse Market: Hardware, Software, Service, Platform, Technology, Solution, Application, Industry Vertical, Sales Channel, NFT, and Country
5.1.10 APAC Metaverse Market: Hardware, Software, Service, Platform, Technology, Solution, Application, Industry Vertical, Sales Channel, NFT, and Country
5.1.11 Latin America Metaverse Market: Hardware, Software, Service, Platform, Technology, Solution, Application, Industry Vertical, Sales Channel, NFT, and Country
5.1.12 MEA Metaverse Market: Hardware, Software, Service, Platform, Technology, Solution, Application, Industry Vertical, Sales Channel, NFT, and Country
5.2 Global Metaverse Users
5.2.1 Global Metaverse User by Platform
5.2.2 Global Metaverse User by Application
5.2.3 Global Metaverse User by Industry Vertical
5.2.4 Global Metaverse NFT User
5.2.5 Global Metaverse User by Region
5.2.5.1 North America Metaverse User: Platform, Application, Industry Vertical, NFT, and Country
5.2.5.2 Europe Metaverse User: Platform, Application, Industry Vertical, NFT, and Country
5.2.5.3 APAC Metaverse User: Platform, Application, Industry Vertical, NFT, and Country
5.2.5.4 Latin America Metaverse User: Platform, Application, Industry Vertical, NFT, and Country
5.2.5.5 MEA Metaverse User: Platform, Application, Industry Vertical, NFT, and Country
Figure 2: Holographic Construction Visual
Figure 3: Holographic Simulation Visual
Figure 4: Virtuality-Reality Integration Visual
Figure 5: Virtual-Reality Linkage Visual
Figure 6: Metaverse Features
Figure 7: Metaverse Building Blocks
Figure 8: Metaverse Market Map and Players
Figure 9: Augmented Reality in Marketing
Figure 10: VR in Vehicle Development
Figure 11: Visual Lifelogging
Figure 12: Mirror World Sharing Mashup
Figure 13: Metaverse Development Timeline
Figure 14: Blockchain Value Chain
Figure 15: Brain Computer Interface Diagram
Figure 16: Digital Twinning Model
Figure 17: VR Sensory Displays
Figure 18: NFT Museum with Digital Art Display
Figure 19: Extended Reality (XR) Framework
Figure 20: Touch Haptic Device
Figure 21: Haptic Sensors
Figure 22: Omnidirectional Treadmill for VR Gaming
Figure 23: Lightweight AR Smart Glass
Figure 24: Head Mounted Displays (HMDs)
Figure 25: Metaverse Desktop Platform
Figure 26: Metaverse Mobile Platform
Figure 27: Metaverse Console Platform
Figure 28: Metaverse Headset/Wearable Platform
Figure 29: Metaverse Application Framework
Figure 30: Metaverse Ecosystem Diagram
Figure 31: Paiduidao Metaverse App
Figure 32: Queppelin Metaverse Element
Figure 33: GoMeta AR Platform
Figure 34: XiRanf Metaverse Navigation for Individual
Figure 35: Walmart VR Shopping
Figure 36: NextMeet Metaverse Meeting Platform
Figure 37: Global Metaverse Market 2022-2027
Figure 38: Global Metaverse Market by Type 2022-2027
Figure 39: Global Metaverse Market by Hardware Type 2022-2027
Figure 40: Global Metaverse Market by XR Hardware Type 2022-2027
Figure 41: Global Metaverse Market by Software Type 2022-2027
Figure 42: Global Metaverse Market by Service Type 2022-2027
Figure 43: Global Metaverse Market by Professional Service Type 2022-2027
Figure 44: Global Metaverse Market by Platform Type 2022-2027
Figure 45: Global Metaverse Market by Technology Type 2022-2027
Figure 46: Global Metaverse Market by Solution Type 2022-2027
Figure 47: Global Metaverse Market by Application Type 2022-2027
Figure 48: Global Metaverse Market by Industry Vertical 2022-2027
Figure 49: Global Metaverse Market by Sales Channel 2022-2027
Figure 50: Global Metaverse NFT Market 2022-2027
Figure 51: Metaverse Market by Regions 2022-2027
Figure 52: North America Metaverse Market by Type 2022-2027
Figure 53: North America Metaverse Market by Hardware Type 2022-2027
Figure 54: North America Metaverse Market by XR Hardware Type 2022-2027
Figure 55: North America Metaverse Market by Software Type 2022-2027
Figure 56: North America Metaverse Market by Service Type 2022-2027
Figure 57: North America Metaverse Market by Professional Service Type 2022-2027
Figure 58: North America Metaverse Market by Platform Type 2022-2027
Figure 59: North America Metaverse Market by Technology Type 2022-2027
Figure 60: North America Metaverse Market by Solution Type 2022-2027
Figure 61: North America Metaverse Market by Application Type 2022-2027
Figure 62: North America Metaverse Market by Industry Vertical 2022-2027
Figure 63: North America Metaverse Market by Sales Channel 2022-2027
Figure 64: North America Metaverse NFT Market 2022-2027
Figure 65: North America Metaverse Market by Country 2022-2027
Figure 66: Europe Metaverse Market by Type 2022-2027
Figure 67: Europe Metaverse Market by Hardware Type 2022-2027
Figure 68: Europe Metaverse Market by XR Hardware Type 2022-2027
Figure 69: Europe Metaverse Market by Software Type 2022-2027
Figure 70: Europe Metaverse Market by Service Type 2022-2027
Figure 71: Europe Metaverse Market by Professional Service Type 2022-2027
Figure 72: Europe Metaverse Market by Platform Type 2022-2027
Figure 73: Europe Metaverse Market by Technology Type 2022-2027
Figure 74: Europe Metaverse Market by Solution Type 2022-2027
Figure 75: Europe Metaverse Market by Application Type 2022-2027
Figure 76: Europe Metaverse Market by Industry Vertical 2022-2027
Figure 77: Europe Metaverse Market by Sales Channel 2022-2027
Figure 78: Europe Metaverse NFT Market 2022-2027
Figure 79: Europe Metaverse Market by Country 2022-2027
Figure 80: APAC Metaverse Market by Type 2022-2027
Figure 81: APAC Metaverse Market by Hardware Type 2022-2027
Figure 82: APAC Metaverse Market by XR Hardware Type 2022-2027
Figure 83: APAC Metaverse Market by Software Type 2022-2027
Figure 84: APAC Metaverse Market by Service Type 2022-2027
Figure 85: APAC Metaverse Market by Professional Service Type 2022-2027
Figure 86: APAC Metaverse Market by Platform Type 2022-2027
Figure 87: APAC Metaverse Market by Technology Type 2022-2027
Figure 88: APAC Metaverse Market by Solution Type 2022-2027
Figure 89: APAC Metaverse Market by Application Type 2022-2027
Figure 90: APAC Metaverse Market by Industry Vertical 2022-2027
Figure 91: APAC Metaverse Market by Sales Channel 2022-2027
Figure 92: APAC Metaverse NFT Market 2022-2027
Figure 93: APAC Metaverse Market by Country 2022-2027
Figure 94: Latin America Metaverse Market by Type 2022-2027
Figure 95: Latin America Metaverse Market by Hardware Type 2022-2027
Figure 96: Latin America Metaverse Market by XR Hardware Type 2022-2027
Figure 97: Latin America Metaverse Market by Software Type 2022-2027
Figure 98: Latin America Metaverse Market by Service Type 2022-2027
Figure 99: Latin America Metaverse Market by Professional Service Type 2022-2027
Figure 100: Latin America Metaverse Market by Platform Type 2022-2027
Figure 101: Latin America Metaverse Market by Technology Type 2022-2027
Figure 102: Latin America Metaverse Market by Solution Type 2022-2027
Figure 103: Latin America Metaverse Market by Application Type 2022-2027
Figure 104: Latin America Metaverse Market by Industry Vertical 2022-2027
Figure 105: Latin America Metaverse Market by Sales Channel 2022-2027
Figure 106: Latin America Metaverse NFT Market 2022-2027
Figure 107: Latin America Metaverse Market by Country 2022-2027
Figure 108: MEA Metaverse Market by Type 2022-2027
Figure 109: MEA Metaverse Market by Hardware Type 2022-2027
Figure 110: MEA Metaverse Market by XR Hardware Type 2022-2027
Figure 111: MEA Metaverse Market by Software Type 2022-2027
Figure 112: MEA Metaverse Market by Service Type 2022-2027
Figure 113: MEA Metaverse Market by Professional Service Type 2022-2027
Figure 114: MEA Metaverse Market by Platform Type 2022-2027
Figure 115: MEA Metaverse Market by Technology Type 2022-2027
Figure 116: MEA Metaverse Market by Solution Type 2022-2027
Figure 117: MEA Metaverse Market by Application Type 2022-2027
Figure 118: MEA Metaverse Market by Industry Vertical 2022-2027
Figure 119: MEA Metaverse Market by Sales Channel 2022-2027
Figure 120: MEA Metaverse NFT Market 2022-2027
Figure 121: MEA Metaverse Market by Country 2022-2027
Figure 122: Global Metaverse Users 2022-2027
Figure 123: Global Metaverse Users by Platform 2022-2027
Figure 124: Global Metaverse Users by Application 2022-2027
Figure 125: Global Metaverse Users by Industry Vertical 2022-2027
Figure 126: Global Metaverse NFT Users 2022-2027
Figure 127: Global Metaverse Users by Region 2022-2027
Figure 128: North America Metaverse Users by Platform 2022-2027
Figure 129: North America Metaverse Users by Application 2022-2027
Figure 130: North America Metaverse Users by Industry Vertical 2022-2027
Figure 131: North America Metaverse NFT Users 2022-2027
Figure 132: North America Metaverse Users by Country 2022-2027
Figure 133: Europe Metaverse Users by Platform 2022-2027
Figure 134: Europe Metaverse Users by Application 2022-2027
Figure 135: Europe Metaverse Users by Industry Vertical 2022-2027
Figure 136: Europe Metaverse NFT Users 2022-2027
Figure 137: Europe Metaverse Users by Country 2022-2027
Figure 138: APAC Metaverse Users by Platform 2022-2027
Figure 139: APAC Metaverse Users by Application 2022-2027
Figure 140: APAC Metaverse Users by Industry Vertical 2022-2027
Figure 141: APAC Metaverse NFT Users 2022-2027
Figure 142: APAC Metaverse Users by Country 2022-2027
Figure 143: Latin America Metaverse Users by Platform 2022-2027
Figure 144: Latin America Metaverse Users by Application 2022-2027
Figure 145: Latin America Metaverse Users by Industry Vertical 2022-2027
Figure 146: Latin America Metaverse NFT Users 2022-2027
Figure 147: Latin America Metaverse Users by Country 2022-2027
Figure 148: MEA Metaverse Users by Platform 2022-2027
Figure 149: MEA Metaverse Users by Application 2022-2027
Figure 150: MEA Metaverse Users by Industry Vertical 2022-2027
Figure 151: MEA Metaverse NFT Users 2022-2027
Figure 152: MEA Metaverse Users by Country 2022-2027
Table 2: Global Metaverse Market by Type 2022-2027
Table 3: Global Metaverse Market by Hardware Type 2022-2027
Table 4: Global Metaverse Market by XR Hardware Type 2022-2027
Table 5: Global Metaverse Market by Software Type 2022-2027
Table 6: Global Metaverse Market by Service Type 2022-2027
Table 7: Global Metaverse Market by Professional Service Type 2022-2027
Table 8: Global Metaverse Market by Platform Type 2022-2027
Table 9: Global Metaverse Market by Technology Type 2022-2027
Table 10: Global Metaverse Market by Solution Type 2022-2027
Table 11: Global Metaverse Market by Application Type 2022-2027
Table 12: Global Metaverse Market by Industry Vertical 2022-2027
Table 13: Global Metaverse Market by Sales Channel 2022-2027
Table 14: Global Metaverse NFT Market 2022-2027
Table 15: Metaverse Market by Regions 2022-2027
Table 16: North America Metaverse Market by Type 2022-2027
Table 17: North America Metaverse Market by Hardware Type 2022-2027
Table 18: North America Metaverse Market by XR Hardware Type 2022-2027
Table 19: North America Metaverse Market by Software Type 2022-2027
Table 20: North America Metaverse Market by Service Type 2022-2027
Table 21: North America Metaverse Market by Professional Service Type 2022-2027
Table 22: North America Metaverse Market by Platform Type 2022-2027
Table 23: North America Metaverse Market by Technology Type 2022-2027
Table 24: North America Metaverse Market by Solution Type 2022-2027
Table 25: North America Metaverse Market by Application Type 2022-2027
Table 26: North America Metaverse Market by Industry Vertical 2022-2027
Table 27: North America Metaverse Market by Sales Channel 2022-2027
Table 28: North America Metaverse NFT Market 2022-2027
Table 29: North America Metaverse Market by Country 2022-2027
Table 30: Europe Metaverse Market by Type 2022-2027
Table 31: Europe Metaverse Market by Hardware Type 2022-2027
Table 32: Europe Metaverse Market by XR Hardware Type 2022-2027
Table 33: Europe Metaverse Market by Software Type 2022-2027
Table 34: Europe Metaverse Market by Service Type 2022-2027
Table 35: Europe Metaverse Market by Professional Service Type 2022-2027
Table 36: Europe Metaverse Market by Platform Type 2022-2027
Table 37: Europe Metaverse Market by Technology Type 2022-2027
Table 38: Europe Metaverse Market by Solution Type 2022-2027
Table 39: Europe Metaverse Market by Application Type 2022-2027
Table 40: Europe Metaverse Market by Industry Vertical 2022-2027
Table 41: Europe Metaverse Market by Sales Channel 2022-2027
Table 42: Europe Metaverse NFT Market 2022-2027
Table 43: Europe Metaverse Market by Country 2022-2027
Table 44: APAC Metaverse Market by Type 2022-2027
Table 45: APAC Metaverse Market by Hardware Type 2022-2027
Table 46: APAC Metaverse Market by XR Hardware Type 2022-2027
Table 47: APAC Metaverse Market by Software Type 2022-2027
Table 48: APAC Metaverse Market by Service Type 2022-2027
Table 49: APAC Metaverse Market by Professional Service Type 2022-2027
Table 50: APAC Metaverse Market by Platform Type 2022-2027
Table 51: APAC Metaverse Market by Technology Type 2022-2027
Table 52: APAC Metaverse Market by Solution Type 2022-2027
Table 53: APAC Metaverse Market by Application Type 2022-2027
Table 54: APAC Metaverse Market by Industry Vertical 2022-2027
Table 55: APAC Metaverse Market by Sales Channel 2022-2027
Table 56: APAC Metaverse NFT Market 2022-2027
Table 57: APAC Metaverse Market by Country 2022-2027
Table 58: Latin America Metaverse Market by Type 2022-2027
Table 59: Latin America Metaverse Market by Hardware Type 2022-2027
Table 60: Latin America Metaverse Market by XR Hardware Type 2022-2027
Table 61: Latin America Metaverse Market by Software Type 2022-2027
Table 62: Latin America Metaverse Market by Service Type 2022-2027
Table 63: Latin America Metaverse Market by Professional Service Type 2022-2027
Table 64: Latin America Metaverse Market by Platform Type 2022-2027
Table 65: Latin America Metaverse Market by Technology Type 2022-2027
Table 66: Latin America Metaverse Market by Solution Type 2022-2027
Table 67: Latin America Metaverse Market by Application Type 2022-2027
Table 68: Latin America Metaverse Market by Industry Vertical 2022-2027
Table 69: Latin America Metaverse Market by Sales Channel 2022-2027
Table 70: Latin America Metaverse NFT Market 2022-2027
Table 71: Latin America Metaverse Market by Country 2022-2027
Table 72: MEA Metaverse Market by Type 2022-2027
Table 73: MEA Metaverse Market by Hardware Type 2022-2027
Table 74: MEA Metaverse Market by XR Hardware Type 2022-2027
Table 75: MEA Metaverse Market by Software Type 2022-2027
Table 76: MEA Metaverse Market by Service Type 2022-2027
Table 77: MEA Metaverse Market by Professional Service Type 2022-2027
Table 78: MEA Metaverse Market by Platform Type 2022-2027
Table 79: MEA Metaverse Market by Technology Type 2022-2027
Table 80: MEA Metaverse Market by Solution Type 2022-2027
Table 81: MEA Metaverse Market by Application Type 2022-2027
Table 82: MEA Metaverse Market by Industry Vertical 2022-2027
Table 83: MEA Metaverse Market by Sales Channel 2022-2027
Table 84: MEA Metaverse NFT Market 2022-2027
Table 85: MEA Metaverse Market by Country 2022-2027
Table 86: Global Metaverse Users 2022-2027
Table 87: Global Metaverse Users by Platform 2022-2027
Table 88: Global Metaverse Users by Application 2022-2027
Table 89: Global Metaverse Users by Industry Vertical 2022-2027
Table 90: Global Metaverse NFT Users 2022-2027
Table 91: Global Metaverse Users by Region 2022-2027
Table 92: North America Metaverse Users by Platform 2022-2027
Table 93: North America Metaverse Users by Application 2022-2027
Table 94: North America Metaverse Users by Industry Vertical 2022-2027
Table 95: North America Metaverse NFT Users 2022-2027
Table 96: North America Metaverse Users by Country 2022-2027
Table 97: Europe Metaverse Users by Platform 2022-2027
Table 98: Europe Metaverse Users by Application 2022-2027
Table 99: Europe Metaverse Users by Industry Vertical 2022-2027
Table 100: Europe Metaverse NFT Users 2022-2027
Table 101: Europe Metaverse Users by Country 2022-2027
Table 102: APAC Metaverse Users by Platform 2022-2027
Table 103: APAC Metaverse Users by Application 2022-2027
Table 104: APAC Metaverse Users by Industry Vertical 2022-2027
Table 105: APAC Metaverse NFT Users 2022-2027
Table 106: APAC Metaverse Users by Country 2022-2027
Table 107: Latin America Metaverse Users by Platform 2022-2027
Table 108: Latin America Metaverse Users by Application 2022-2027
Table 109: Latin America Metaverse Users by Industry Vertical 2022-2027
Table 110: Latin America Metaverse NFT Users 2022-2027
Table 111: Latin America Metaverse Users by Country 2022-2027
Table 112: MEA Metaverse Users by Platform 2022-2027
Table 113: MEA Metaverse Users by Application 2022-2027
Table 114: MEA Metaverse Users by Industry Vertical 2022-2027
Table 115: MEA Metaverse NFT Users 2022-2027
Table 116: MEA Metaverse Users by Country 2022-2027
2.1.1 6G Key Performance Indicators
2.1.2 5G and 6G Comparison
2.2 6G Roadmap: Evolution to 6G Wireless Networks
2.3 Beyond 5G Evolution, 5G Context, and 6G
2.3.1 Much Greater Data Speed
2.3.2 Focus on Edge Computing for Latency Reduction
2.3.3 Dealing with Radio Propagation and Mobility Challenges
2.3.4 Providing Massively Scalable Support for IoT
2.3.5 Increased Emphasis on Private Networks for Business
2.4 6G Network Elements
2.4.1 New Spectrum and Frequencies
2.4.2 Many More Radio Access Points
2.4.3 Changes to Core Networks
2.4.4 Evolution of the Datacenter
2.5 6G Features
2.5.1 THz Wave Communication
2.5.2 Energy Saving Communication
2.5.3 Operational, Environmental, and Service Intelligence
2.5.4 Improved Security and Privacy
2.5.5 Connected Satellite Network and Intelligence
2.5.6 Synergy among Information and Energy
2.5.7 Super 3D Connectivity
2.5.8 Small Cell Network
2.5.9 Ultra-Dense Heterogeneous Networks
2.5.10 High Capacity Backhaul
2.5.11 Integration of Mobile Technology with Radar
2.5.12 Softwarization and virtualization
2.6 6G Benefits
2.7 6G Growth Drivers
2.7.1 The Need for Microsecond Latency
2.7.2 Growth of IoT and Industrial, Object Driven Traffic
2.7.3 Wireless Cognition, Single Core Structure, and Public Safety
2.7.4 Smart City Applications: Sensing and More
2.7.5 Ubiquitous Coverage from Satellite Internet to Ultra-Local Networks
2.7.5.1 Ultra-Macro Coverage
2.7.5.2 Ultra-Micro Coverage
2.7.6 Fully Digital and Connected World
2.7.7 Significant amounts of Data will be Created
2.7.8 Considerable Catalyst for HPC and Quantum Computing
2.7.9 Substantial Disintermediation
2.7.10 Fundamental Improvements in User Experience
2.7.11 Unprecedented Impacts on Industry Verticals
2.7.12 6G Makes Democratizes Intelligence
2.7.12.1 Smart Surfaces
2.7.12.2 Smart Environments
2.7.12.3 Smart Power
2.7.13 UN Sustainable Development Goals
2.7.14 Private-Public Industry Collaboration
2.7.15 Hyper Connected Intelligent World
2.8 6G Market Challenges
2.8.1 High Deployment Expenditures
2.8.2 Vertical Business Model Considerations
2.8.3 Voice and Data Value Perception Approaches Zero
2.8.4 Extreme Focus on Local Communication and Networking
2.8.5 Device to Device Signaling, Relay, and Mesh Networks
2.8.6 Supporting Micro-Operators Networks
2.8.7 High Security and Privacy Issue
2.9 6G Business Models
2.9.1 Decentralized Business Model
2.9.2 Partitive Business Model for MNOs
2.9.3 Private Network Model
2.9.4 Micro-operators and Distributed Services Model
2.10 6G Value Chain
2.10.1 User Equipment Manufacturers
2.10.2 Infrastructure Manufacturers
2.10.3 Connectivity Providers
2.10.4 IoT Solution Provider
2.10.5 Analytics Solution Providers
2.10.6 Enterprise, Government, and Industrial Users
2.10.7 Software Solution Providers
2.11 6G Economic and Cultural Impacts
2.12 6G Research Initiatives and Industry Development
2.12.1 China
2.12.2 United States
2.12.3 Canada
2.12.4 Japan
2.12.5 South Korea
2.12.6 Finland (6G Flagship)
2.12.7 European Commission
2.12.8 International Telecommunication Union
3.1.1 95 GHz to 3 THz Frequency Bands
3.1.2 THz Spectrum and Benefits
3.1.3 Radio Frequency and Data Rates Targeting One Terabit
3.1.4 Unlicensed Spectrum and Private Networks
3.1.4.1 NR U and 6G U
3.1.4.2 6G Private Networks
3.1.5 Citizens Broadband Radio Service and Spectrum Sharing
3.1.6 Impact of Softwarization and AI
3.2 6G Network Management and Orchestration
3.3 6G Communication Infrastructure
3.3.1 Physical, Digital, and Biological System Convergence
3.3.2 Short Range Communication Impact
3.3.3 AI and Machine Learning
3.3.4 Inter-Protocol Interference
3.3.5 Molecular communications
3.3.6 Internet of Nano-Things
3.3.7 Internet of Sense
3.4 6G Communication Technology
3.4.1 Substantial Improvements in Enhanced Mobile Broadband
3.4.2 Secure Ultra-Reliable Low-Latency Communications
3.4.3 3D Integrated Communications
3.4.4 Unconventional Data Communications
3.5 6G Enabling Technology
3.5.1 Terahertz Frequency
3.5.2 Optical Wireless Technology
3.5.3 FSO Backhaul Network
3.5.4 Blockchain-based Spectrum Sharing
3.5.5 3D Networking and Unmanned Aerial Vehicle
3.5.6 Call Free Communications
3.5.7 Integration of WIET, Sensing and Communication, and Access Backhaul Networks
3.5.8 Dynamic Network Slicing
3.5.9 Holographic Beamforming
3.5.10 Supermassive Intelligent Surface Assisted MIMO and Large-Scale Antenna Arrays
3.5.11 AI-Assisted PHY Technology
3.5.12 Mobility Enhanced Edge Intelligence
3.5.13 Modern Random-Access Protocols for IoT
3.5.14 Radio Access Technology in Industry 4.0
3.5.15 Semantic Intelligence
3.5.16 Encryption Technologies
3.5.17 Visible Light Communication and Sub-THz Communication
3.5.18 Orbital Angular Momentum Multiplexing
3.5.19 CMOS Technology and Intelligent Chips
3.5.20 Fixed Wireless Access
3.5.21 Quasi-Optical Antennas
3.5.22 Artificial Intelligence and IoT Fusion
3.5.23 Digital Signal Processing Techniques
3.6 6G Infrastructure Market
3.6.1 6G User Devices
3.6.1.1 Smartphones and other Handheld Devices
3.6.1.2 Wearables and Implantable
3.6.1.3 Modems, Gateways, Access Points
3.6.1.4 Vehicle Communications
3.6.1.5 Buildings and Facility Communications
3.6.2 6G Core Infrastructure
3.6.3 6G Equipment Market
3.6.3.1 Telecom Equipment
3.6.3.2 Semiconductor Equipment
3.6.3.2.1 MEET Device
3.6.3.2.2 6G Chip
3.6.3.2.3 Terahertz Receiver
3.6.3.2.4 Nanoscale Atomristor Switch
3.6.3.3 Equipment Cost Consideration
3.6.4 6G Materials Market
3.6.5 6G Transport Networks
3.7 6G R&D Investments
3.8 6G Testbeds for Technology Acceptance and Market Development
3.9 6G Solution Areas
3.9.1 6G Communications
3.9.2 6G Sensing
3.9.3 6G Imaging
3.9.4 6G Precise Location
3.10 6G Use Cases and Potential Applications
3.10.1 Volumetric Media Streaming
3.10.2 Connected Manufacturing and Automation
3.10.3 Multi-Sensory Extended Reality
3.10.4 Next Generation Healthcare
3.10.5 Brain-Computer Interaction and Touch Control System
3.10.6 Connected Robotics and Autonomous Systems
3.10.7 Five Sense Information Transfer
3.10.8 Internet of Everything
3.11 6G Synergies with Next Generation Computing
3.11.1 Multi Access Edge Computing
3.11.2 High Performance Computing
3.11.3 Quantum Computing
3.11.4 Quantum Technologies: Communication, Sensing, Simulation, and Imaging
3.11.5 Next Generation Computing
3.11.6 Digital Twining Technology, Smart Machines, and Physical-Cyber Convergence
4.2 Autotalks
4.3 Broadcom Corporation
4.4 China Telecom
4.5 China Unicom
4.6 Cisco Systems
4.7 Corning Incorporated
4.8 DARPA
4.9 DeepSig
4.10 Ericsson
4.11 Facebook Connectivity
4.12 Federated Wireless
4.13 Fujitsu
4.14 Google
4.15 Huawei
4.16 InterDigital
4.17 Karlsruhe Institute of Technology
4.18 Keysight Technologies
4.19 LG Corporation
4.20 MediaTek
4.21 Motorola Solutions
4.22 Nanyang Technological University
4.23 National Science Foundation
4.24 Nokia (Bell Labs)
4.25 NEC Corporation
4.26 NTT DoCoMo
4.27 NVidia
4.28 NYU Wireless
4.29 Orange
4.30 NGMN Alliance
4.31 Qualcomm
4.32 Samsung Electronics
4.33 SK Telecom
4.34 T-Mobile
4.35 TU Braunschweig
4.36 ComSenTer (University of California)
4.37 University of Oulu (6G Flagship)
4.38 Virginia Diodes
4.39 National Instrument Corp.
4.40 Virginia Tech
4.41 Verizon Wireless
4.42 ZTE
4.43 Reliance Jio Infocomm Limited
5.1.1 Global 6G Infrastructure Market
5.1.2 Global 6G Infrastructure Market by Type
5.1.2.1 Global 6G Infrastructure Market by End User Device
5.1.2.2 Global 6G Infrastructure Market by Equipment
5.1.2.3 Global 6G Infrastructure Market by Semiconductors
5.1.2.4 Global 6G Infrastructure Market by 6G Materials
5.1.3 Regional 6G Infrastructure Market
5.1.3.1 6G Infrastructure Market by Region
5.1.3.1.1 APAC 6G Infrastructure Market: Device, Equipment, and Materials
5.1.3.1.2 North America 6G Infrastructure Market: Device, Equipment, and Materials
5.1.3.1.3 Europe 6G Infrastructure Market: Device, Equipment, and Materials
5.1.3.1.4 MEA 6G Infrastructure Market: Device, Equipment, and Materials
5.1.3.1.5 Latin America 6G Infrastructure Market: Device, Equipment, and Materials
5.2 6G Infrastructure Unit Deployment 2024-2030
5.2.1 Global 6G Infrastructure Unit Deployment
5.2.2 Global 6G Infrastructure Unit Deployment by Type
5.2.2.1 Global 6G End User Device Unit Deployment
5.2.2.2 Global 6G Infrastructure Unit Deployment by Equipment
5.2.2.3 Global 6G Semiconductor Unit Deployment
5.2.3 6G Infrastructure Unit Deployment by Region
5.2.3.1 APAC 6G Infrastructure Unit Deployment: Device, Equipment, and Country
5.2.3.2 North America 6G Infrastructure Unit Deployment: Device, Equipment, and Country
5.2.3.3 Europe 6G Infrastructure Unit Deployment: Device, Equipment, and Country
5.2.3.4 MEA 6G Infrastructure Unit Deployment: Device, Equipment, and Country
5.2.3.5 Latin America 6G Infrastructure Unit Deployment: Device, Equipment, and Country
5.3 6G Testbeds Market 2024-2030
5.3.1 Global 6G Testbed PaaS Market
5.3.2 Global 6G Testbed PaaS Market by Region
5.3.3 Global 6G Testbed PaaS Market by Country
5.4 6G Investment 2022-2030
5.4.1 Global 6G R&D Investment
5.4.1.1 Global 6G R&D Investment by Funding Type
5.4.2 Global 6G Core Infrastructure Investment
5.4.3 Global 6G Transport Network Investment
6.2 Artificial Intelligence Providers
6.3 Automotive Companies
6.4 Broadband Infrastructure Providers
6.5 Communication Service Providers
6.6 Computing Companies
6.7 Data Analytics Providers
6.8 Immersive Technology (AR, VR, and MR) Providers
6.9 Networking Equipment Providers
6.10 Networking Security Providers
6.11 Semiconductor Companies
6.12 IoT Suppliers and Service Providers
6.13 Software Providers
6.14 Smart City System Integrators
6.15 Automation System Providers
6.16 Social Media Companies
6.17 Telecom Operators
6.18 OTT Service Providers
6.19 Enterprise and Government
7.1.1 5G Communication Technology
7.1.1.1 Enhanced Mobile Broadband (eMBB)
7.1.1.2 Ultra-reliable Low-latency Communications (URLLC)
7.1.1.3 Massive Machine-type Communications (mMTC)
7.1.2 Service Based Architecture and Orchestration
7.1.3 Fixed Wireless Access
7.1.4 Edge Computing with Communication
7.1.5 Smart Antennas with MIMO and Beamforming
7.1.6 Smart Surfaces Technology
7.2 5G Applications to Expedite 6G Evolution
7.2.1 Retail and Consumer Electronics Applications
7.2.2 Healthcare Applications
7.2.3 Industrial Automation Applications
7.2.4 Intelligent Building Automation Applications
7.2.5 Automotive and Transportation Applications
7.2.6 Home Automation Applications
7.2.7 Financial Institution Applications
7.2.8 Energy and Utilities Applications
7.2.9 Public Safety Applications
7.2.10 Military Applications
7.2.11 Oil and Gas Applications
7.2.12 Mining Applications
7.2.13 Agriculture Applications
7.3 5G Service Market 2022-2030
7.3.1 5G Service Market by Communication Technology
7.3.1.1 5G eMBB Market by Application
7.3.1.2 5G mMTC Market by Application
7.3.1.3 5G URLLC Market by Application
7.3.1.4 5G FWA Market by Application
7.3.2 5G Service Market by Communication Device
7.3.3 5G Market by Service Provider
7.3.3.1 5G Carrier/MNO Service Market
7.3.3.1.1 5G Consumer Application Market
7.3.3.1.2 5G Enterprise Application Market
7.3.3.1.3 5G Government Application Market
7.3.3.2 5G OTT Service Market
7.4 5G New Radio Application Market 2022-2030
Figure 2: Comparison: 5G vs. 6G Wireless Communication
Figure 3: Evolution of Wireless Communication: 1G to 6G
Figure 4: Edge Computing and Latency
Figure 5: 5G Accelerates Private Wireless Networks
Figure 6: Local and Personal Networks
Figure 7: Tomorrow’s World of Everything is an Access Point
Figure 8: 6G AI “Nanocore” Infrastructure
Figure 9: THz Electromagnetic Spectrum Considerations
Figure 10: 6G Key Features
Figure 11: 6G Connected World
Figure 12: Smart Surfaces
Figure 13: Smart Environment
Figure 14: Private Network Diagram
Figure 15: CBRS Spectrum Sharing
Figure 16: 6G Network Orchestration
Figure 17: 6G Communication Architecture
Figure 18: 6G Communication Technology
Figure 19: Semantic Intelligence in Automated Factory
Figure 20: Sub-THz Hardware IC Technology
Figure 21: Visible Light Communication: Mbps to Tbps
Figure 22: Intelligent O-RAN Architecture
Figure 23: 6G Sub-Terahertz Testbed
Figure 24: Global 6G Infrastructure Market 2024-2030
Figure 25: Global 6G Infrastructure Unit Deployment 2024-2030
Figure 26: Global 6G Testbed PaaS Market 2024-2030
Figure 27: Global 6G R&D Investment 2022-2030
Figure 28: Global 6G Core Infrastructure Investment 2022-2030
Figure 29: Global 6G Transport Network Investment 2022-2030
Figure 30: 5G Communication Technologies
Table 2: Global 6G Infrastructure Market by Type 2024-2030
Table 3: Global 6G Market by End User Device 2024-2030
Table 4: Global 6G Infrastructure Market by Equipment 2024-2030
Table 5: Global 6G Market by Semiconductors 2024-2030
Table 6: Global 6G Infrastructure Market by 6G Materials 2024-2030
Table 7: Global 6G Infrastructure Market by Region 2024-2030
Table 8: APAC 6G Infrastructure Market by Type 2024-2030
Table 9: APAC 6G Market by End User Device 2024-2030
Table 10: APAC 6G Infrastructure Market by Equipment 2024-2030
Table 11: APAC 6G Market by Semiconductors 2024-2030
Table 12: APAC 6G Infrastructure Market by 6G Materials 2024-2030
Table 13: APAC 6G Infrastructure Market by Country 2024-2030
Table 14: North America 6G Infrastructure Market by Type 2024-2030
Table 15: North America 6G Market by End User Device 2024-2030
Table 16: North America 6G Infrastructure Market by Equipment 2024-2030
Table 17: North America 6G Market by Semiconductors 2024-2030
Table 18: North America 6G Infrastructure Market by 6G Materials 2024-2030
Table 19: North America 6G Infrastructure Market by Country 2024-2030
Table 20: Europe 6G Infrastructure Market by Type 2024-2030
Table 21: Europe 6G Market by End User Device 2024-2030
Table 22: Europe 6G Infrastructure Market by Equipment 2024-2030
Table 23: Europe 6G Market by Semiconductors 2024-2030
Table 24: Europe 6G Infrastructure Market by 6G Materials 2024-2030
Table 25: Europe 6G Infrastructure Market by Country 2024-2030
Table 26: MEA 6G Infrastructure Market by Type 2024-2030
Table 27: MEA 6G Market by End User Device 2024-2030
Table 28: MEA 6G Infrastructure Market by Equipment 2024-2030
Table 29: MEA 6G Market by Semiconductors 2024-2030
Table 30: MEA 6G Infrastructure Market by 6G Materials 2024-2030
Table 31: MEA 6G Infrastructure Market by Country 2024-2030
Table 32: Latin America 6G Infrastructure Market by Type 2024-2030
Table 33: Latin America 6G Market by End User Device 2024-2030
Table 34: Latin America 6G Infrastructure Market by Equipment 2024-2030
Table 35: Latin America 6G Market by Semiconductors 2024-2030
Table 36: Latin America 6G Infrastructure Market by 6G Materials 2024-2030
Table 37: Latin America 6G Infrastructure Market by Country 2024-2030
Table 38: Global 6G Infrastructure Unit Deployment by Type 2024-2030
Table 39: Global 6G End User Device Unit Deployment 2024-2030
Table 40: Global 6G Infrastructure Unit Deployment by Equipment 2024-2030
Table 41: Global 6G Semiconductor Unit Deployment 2024-2030
Table 42: Global 6G Infrastructure Unit Deployment by Region 2024-2030
Table 43: APAC 6G Infrastructure Unit Deployment by Type 2024-2030
Table 44: APAC 6G End User Device Unit Deployment 2024-2030
Table 45: APAC 6G Infrastructure Unit Deployment by Equipment 2024-2030
Table 46: APAC 6G Semiconductor Unit Deployment 2024-2030
Table 47: APAC 6G Infrastructure Unit Deployment by Country 2024-2030
Table 48: North America 6G Infrastructure Unit Deployment by Type 2024-2030
Table 49: North America 6G End User Device Unit Deployment 2024-2030
Table 50: North America 6G Infrastructure Unit Deployment by Equipment 2024-2030
Table 51: North America 6G Semiconductor Unit Deployment 2024-2030
Table 52: North America 6G Infrastructure Unit Deployment by Country 2024-2030
Table 53: Europe 6G Infrastructure Unit Deployment by Type 2024-2030
Table 54: Europe 6G End User Device Unit Deployment 2024-2030
Table 55: Europe 6G Infrastructure Unit Deployment by Equipment 2024-2030
Table 56: Europe 6G Semiconductor Unit Deployment 2024-2030
Table 57: Europe 6G Infrastructure Unit Deployment by Country 2024-2030
Table 58: MEA 6G Infrastructure Unit Deployment by Type 2024-2030
Table 59: MEA 6G End User Device Unit Deployment 2024-2030
Table 60: MEA 6G Infrastructure Unit Deployment by Equipment 2024-2030
Table 61: MEA 6G Semiconductor Unit Deployment 2024-2030
Table 62: MEA 6G Infrastructure Unit Deployment by Country 2024-2030
Table 63: Latin America 6G Infrastructure Unit Deployment by Type 2024-2030
Table 64: Latin America 6G End User Device Unit Deployment 2024-2030
Table 65: Latin America 6G Infrastructure Unit Deployment by Equipment 2024-2030
Table 66: Latin America 6G Semiconductor Unit Deployment 2024-2030
Table 67: Latin America 6G Infrastructure Unit Deployment by Country 2024-2030
Table 68: Global 6G Testbed PaaS Market by Region 2024-2030
Table 69: Global 6G Testbed PaaS Market by Country 2024-2030
Table 70: Global 6G R&D Investment by Funding Type 2022-2030
Table 71: Global 5G Service Market by Communication Technology 2022-2030
Table 72: Global 5G Market by eMBB Application 2022-2030
Table 73: Global 5G Market by eMBB Application 2022-2030
Table 74: Global 5G Market by URLLC Application 2022-2030
Table 75: Global 5G Market by FWA Application 2022-2030
Table 76: Global 5G Service Market by Communication Device 2022-2030
Table 77: Global 5G Market by Service Provider 2022-2030
Table 78: Global 5G Carrier/MNO Service Market by Application 2022-2030
Table 79: Global 5G Carrier/MNO Service Market by Consumer Application 2022-2030
Table 80: Global 5G Carrier/MNO Service Market by Business Application 2022-2030
Table 81: Global 5G Carrier/MNO Service Market by Government Application 2022-2030
Table 82: Global 5G OTT Service Market by Application 2022-2030
Table 83: Global 5G OTT Service Market by Application 2022-2030
2.1.1 Understanding Digital Twinning
2.1.2 Cognitive Digital Twining
2.1.3 Digital Thread
2.1.4 Convergence of Sensors and Simulations
2.1.5 IoT APIs
2.1.6 Software Modules and Elements
2.1.7 Types of Digital Twinning
2.1.8 Digital Twinning Work Processes
2.1.9 Role and Importance of Digital Twinning
2.2 Related Technologies and Impact on Digital Twinning
2.2.1 Industrial Internet and Industry 4.0
2.2.2 Pairing Technology
2.2.3 Cyber-to-Physical Systems
2.2.4 AR, VR, and Mixed Reality
2.2.5 Artificial Intelligence and Machine Learning
2.2.6 Additive Manufacturing and 3D Printing
2.3 Potential Application and Outcome Analysis
2.3.1 Maintenance, Repair and Overhaul Operation
2.3.2 Digital Avatar of Consumer Assets
2.3.3 Performance/Service Monitoring
2.3.4 Inspection and Repairs
2.3.5 Predictive Maintenance
2.3.6 Product Design & Development
2.3.7 Composite Assembling/Manufacturing
2.3.8 Potential Business Outcomes
2.4 Digital Twinning Service Ecosystem
2.4.1 Industrial IoT
2.4.2 Consumer IoT
2.4.3 Industry Development
2.4.4 Digital Twinning as a Service
3.2 Allerin Tech Pvt. Ltd.
3.3 Altair Engineering, Inc.
3.4 Amazon Web Services
3.5 ANSYS
3.6 Aucotec AG
3.7 Autodesk Inc.
3.8 Bentley Systems, Incorporated
3.9 CADFEM GmbH
3.10 Cisco Systems
3.11 Cityzenith
3.12 Cosmo Tech
3.13 Dassault Systems
3.14 Digital Twin Consortium
3.15 Digital Twin Technologies
3.16 DNV GL
3.17 DXC Technology
3.18 Eclipse Foundation
3.19 Emerson
3.20 Emesent
3.21 Faststream Technologies
3.22 FEINGUSS BLANK GmbH
3.23 Flowserve
3.24 Forward Networks
3.25 General Electric
3.26 Google
3.27 Hitachi Ltd.
3.28 Honeywell
3.29 HP
3.30 IBM
3.31 Industrial Internet Consortium
3.32 Intellias
3.33 Invicara
3.34 KBMax
3.35 Lanner Electronics
3.36 Microsoft
3.37 National Instruments
3.38 NavVis
3.39 Oracle
3.40 PETRA Data Science
3.41 Physical Web
3.42 Pratiti Technologies
3.43 Prodea System Inc.
3.44 PTC
3.45 QiO Technologies
3.46 Robert Bosch
3.47 SAP
3.48 Schneider
3.49 SenSat
3.50 Siemens
3.51 Sight Machine Inc.
3.52 Simplifa GmbH
3.53 Softweb Solutions Inc.
3.54 Sogeti Group
3.55 SWIM.AI
3.56 Synavision
3.57 Sysmex Corporation
3.58 TIBCO Software
3.59 Toshiba Corporation
3.60 UrsaLeo
3.61 Virtalis Limited
3.62 Visualiz
3.63 Wipro Limited
3.64 XenonStack
3.65 Zest Labs
4.2 Digital Twins Market by Type of Twinning 2022-2027
4.3 Digital Twins Applications 2022-2027
4.4 Digital Twins by Industry 2022-2027
4.4.1 Digital Twins in Manufacturing by Type 2022-2027
4.4.2 Digital Twins in Smart City by Type 2022-2027
4.4.3 Digital Twins in Automotive by Type 2022-2027
4.4.4 Digital Twins in Healthcare by Type 2022-2027
4.4.5 Digital Twins in Transport by Type 2022-2027
4.5 Digital Twins by Region 2022-2027
4.5.1 North America Digital Twins 2022-2027
4.5.2 South America Digital Twins 2022-2027
4.5.3 Europe Digital Twins 2022-2027
4.5.4 APAC Digital Twins 2022-2027
4.5.5 MEA Digital Twins 2022-2027
Figure 2: Building Blocks of Cognitive Digital Twinning
Figure 3: Digital Thread Model in Digital Manufacturing Transformation Processes
Figure 4: Example of Types of Digital Twinning
Figure 5: Industrial Internet Building Block and Digital Twinning
Figure 6: Additive Manufacturing Path and Goals
Figure 7: Digital Thread for Additive Manufacturing in AM Process
Figure 8: Data Fusion for MRO Operation
Figure 9: Composite Manufacturing Model
Figure 10: Digital Twinning Application and Outcomes
Figure 11: Global Digital Twins 2022-2027
Figure 12: Digital Twins Types 2022-2027
Figure 13: Digital Twins Applications 2022-2027
Figure 14: Digital Twins by Industry 2022-2027
Figure 15: Digital Twins in Manufacturing by Type 2022-2027
Figure 16: Digital Twins in Manufacturing by Application 2022-2027
Figure 17: Digital Twins in Smart City by Type 2022-2027
Figure 18: Digital Twins in Smart City by Application 2022-2027
Figure 19: Digital Twins in Automotive by Type 2022-2027
Figure 20: Digital Twins in Automotive by Application 2022-2027
Figure 21: Digital Twins in Healthcare by Type 2022-2027
Figure 22: Digital Twins in Healthcare by Application 2022-2027
Figure 23: Digital Twins in Transport by Type 2022-2027
Figure 24: Digital Twins in Transport by Application 2022-2027
Figure 25: Digital Twins by Region 2022-2027
Figure 26: North America Digital Twins by Country 2022-2027
Figure 27: North America Digital Twins by Industry 2022-2027
Figure 28: United States Digital Twins 2022-2027
Figure 29: Canada Digital Twins 2022-2027
Figure 30: Mexico Digital Twins 2022-2027
Figure 31: South America Digital Twins by Country 2022-2027
Figure 32: South America Digital Twins by Industry 2022-2027
Figure 33: Argentina Digital Twins 2022-2027
Figure 34: Brazil Digital Twins 2022-2027
Figure 35: Chile Digital Twins 2022-2027
Figure 36: Europe Digital Twins by Country 2022-2027
Figure 37: Europe Digital Twins by Industry 2022-2027
Figure 28: U.K. Digital Twins 2022-2027
Figure 39: Germany Digital Twins 2022-2027
Figure 40: France Digital Twins 2022-2027
Figure 41: Spain Digital Twins 2022-2027
Figure 42: Italy Digital Twins 2022-2027
Figure 43: Poland Digital Twins 2022-2027
Figure 44: Russia Digital Twins 2022-2027
Figure 45: APAC Digital Twins by Country 2022-2027
Figure 46: APAC Digital Twins by Industry 2022-2027
Figure 47: China Digital Twins 2022-2027
Figure 48: Japan Digital Twins 2022-2027
Figure 49: South Korea Digital Twins 2022-2027
Figure 50: Australia Digital Twins 2022-2027
Figure 51: India Digital Twins 2022-2027
Figure 52: MEA Digital Twins by Country 2022-2027
Figure 53: MEA Digital Twins by Industry 2022-2027
Figure 54: Qatar Digital Twins 2022-2027
Figure 55: Kuwait Digital Twins 2022-2027
Figure 56: Saudi Arabia Digital Twins 2022-2027
Figure 57: South Africa Digital Twins 2022-2027
Table 2: Digital Twins Market by Type of Twinning 2022-2027
Table 3: Digital Twins Applications 2022-2027
Table 4: Digital Twins by Industry 2022-2027
Table 5: Digital Twins in Manufacturing by Type 2022-2027
Table 6: Digital Twins in Manufacturing by Application 2022-2027
Table 7: Digital Twins in Smart City by Type 2022-2027
Table 8: Digital Twins in Smart City by Application 2022-2027
Table 9: Digital Twins in Automotive by Type 2022-2027
Table 10: Digital Twins in Automotive by Application 2022-2027
Table 11: Digital Twins in Healthcare by Type 2022-2027
Table 12: Digital Twins in Healthcare by Application 2022-2027
Table 13: Digital Twins in Transport by Type 2022-2027
Table 14: Digital Twins in Transport by Application 2022-2027
Table 15: Digital Twins by Region 2022-2027
Table 16: North America Digital Twins by Country 2022-2027
Table 17: North America Digital Twins by Industry 2022-2027
Table 18: South America Digital Twins by Country 2022-2027
Table 19: South America Digital Twins by Industry 2022-2027
Table 20: Europe Digital Twins by Country 2022-2027
Table 21: Europe Digital Twins by Industry 2022-2027
Table 22: APAC Digital Twins by Country 2022-2027
Table 23: APAC Digital Twins by Industry 2022-2027
Table 24: MEA Digital Twins by Country 2022-2027
Table 25: MEA Digital Twins by Industry 2022-2027
2.1.1 Reconfigurable Intelligent Surfaces
2.1.2 Smart Radio Environment
2.1.3 Smart Surface Construction
2.2 5G to 6G Communication System and Smart Surface Technology
2.3 RIS Technology Implementation Benefits
2.4 Smart Surface Financial Benefits
2.5 Market Driver Analysis
2.6 Market Challenge Analysis
2.7 Pandemic Impact
2.8 Value Chain Analysis
2.8.1 Smart Materials Producers
2.8.2 Semiconductor Companies
2.8.3 Coating Companies
2.8.4 IoT and Communication Service Providers
2.8.5 Device and Application Manufactures
2.9 Standardization Activities
2.9.1 ETSI to Launch New Group on RIS
2.9.2 Collaborative Research and IEEE COMSOC Initiatives
2.9.3 Policy and Equity Implications
2.9.4 Smart Surfaces Coalition
3.1.1 Self-Healing Materials
3.1.2 Self-Cleaning Materials
3.1.3 Self-Assembling Materials
3.1.4 Self-Sensing Materials
3.1.5 Photovoltaics Materials
3.1.6 Anti-Fouling Coatings
3.1.7 Self-Dimming/Color Shifting Coating
3.1.8 Self-Tinting Materials
3.2 Smart Surface Sensing Analysis
3.2.1 Pressure
3.2.2 Temperature
3.2.3 Movement
3.2.4 Presence/Occupancy
3.2.5 Surface Tension
3.2.6 Light
3.2.7 Mechanical Forces
3.2.8 Ionic Strength
3.2.9 pH
3.2.10 Electric and Magnetic Fields
3.3 Single Layer vs. Multi-Layer Coating
3.4 Smart Surface Application Analysis
3.4.1 General Application Area
3.4.2 Industry Vertical
3.4.3 Residential Sector
3.4.4 Commercial Sector
3.4.5 Industrial Sector
3.4.6 Government Sector
3.5 Smart Surface Product Pricing
3.5.1 Regional Impact
3.5.2 Urban Consumption
3.6 Smart Surface Technology Development and Impact
3.6.1 Impact on Daily Lives
3.6.2 Impact on Infrastructure
3.6.3 Technology Evolution
3.6.4 Technology Investment
3.6.5 Integration with Other Technologies
3.6.6 Innovation within Smart Surface Technology
3.6.7 Smarter HMIs
4.2 A&K Painting
4.3 Adapta Color S.L.
4.4 Akzonobel
4.5 AnCatt Inc.
4.6 Axalta Coating Systems
4.7 BASF SE
4.8 Bayer AG
4.9 Clariant AG
4.10 Debiotech SA
4.11 Dow
4.12 DryWired
4.13 DuPont
4.14 Eastman Chemical Company
4.15 Gentex Corporation
4.16 Kansai Helios
4.17 Hempel A/S
4.18 HZO Inc.
4.19 Inducoat
4.20 Industrial Nanotech
4.21 Jotun A/S
4.22 Nanoshell Company
4.23 NanoShine Ltd.
4.24 Nanoshine Group Corp.
4.25 Nanotron Technologies (Inpixon Company)
4.26 NEI Corporation
4.27 P2i Limited
4.28 PPG Industries
4.29 Remcom
4.30 Royal DSM
4.31 RPM International
4.32 Sherwin-Williams
4.33 Surfactis Technologies
4.34 Tesla Nanocoating
4.35 The Lubrizol Corporation
4.36 TST (Thermal Spray Technologies) Inc.
4.37 Valresa Coating
4.38 Denso North America
4.39 Evonik
4.40 View Inc.
4.41 Miru Smart Technologies
4.42 Cardinal Glass
4.43 Johnson Controls
4.44 Faurecia
4.45 Henkel
4.46 Smart Surfaces Coalition
5.1.1 Global Smart Surface Market by Product Type
5.1.2 Global Smart Surface Market by Sensing Type
5.1.3 Global Smart Surface Market by Coating Application Layer
5.1.4 Global Smart Surface Market by Sector
5.1.5 Global Smart Surface Market by Industry Vertical
5.1.6 Global Smart Surface Market by Region
5.1.6.1 North America Smart Surface Market by Country
5.1.6.2 Europe Smart Surface Market by Country
5.1.6.3 APAC Smart Surface Market by Country
5.1.6.4 MEA Smart Surface Market by Country
5.1.6.5 Latin America Smart Surface Market by Country
5.2 Global Smart Surface Product Market Value 2022-2027
5.2.1 Overall Value 2022-2027
5.2.2 Global Smart Surface Average Price by Product Type
5.3 Global Smart Surface Production Volume 2022-2027
5.3.1 Global Smart Surface Production Volume by Product Type
5.3.2 Global Smart Surface Production Volume by Region
5.3.2.1 North America Smart Surface Production Volume by Country
5.3.2.2 Europe Smart Surface Production Volume by Country
5.3.2.3 APAC Smart Surface Production Volume by Country
5.3.2.4 RoW Smart Surface Production Volume by Country
5.4 Global Smart Surface Product Consumption Volume 2022-2027
5.4.1 Global Smart Surface Product Consumption Volume by Sensing Type
5.4.2 Global Smart Surface Product Consumption Volume by Coating Application Layer
5.4.3 Global Smart Surface Product Consumption Volume by Application Sector
5.4.4 Global Smart Surface Product Consumption Volume by Industry Vertical
5.4.5 Global Smart Surface Product Consumption Volume by Region
5.4.5.1 North America Smart Surface Product Consumption Volume by Country
5.4.5.2 Europe Smart Surface Product Consumption Volume by Country
5.4.5.3 APAC Smart Surface Product Consumption Volume by Country
5.4.5.4 MEA Smart Surface Product Consumption Volume by Country
5.4.5.5 Latin America Smart Surface Product Consumption Volume by Country
5.5 Global 6G Communication Smart Surface Market 2030-2035
5.5.1 Global 6G Communication Smart Surface Market by Product Type
5.5.2 Global 6G Communication Smart Surface Market by Materials Type
5.5.3 Global 6G Communication Smart Surface Market by Region
5.5.3.1 North America 6G Communication Smart Surface Market by Country
5.5.3.2 Europe 6G Communication Smart Surface Market by Country
5.5.3.3 APAC 6G Communication Smart Surface Market by Country
5.5.3.4 RoW 6G Communication Smart Surface Market by Country
Figure 2: RIS Architecture
Figure 3: RIS-SRE
Figure 4: Smart Window Surface
Figure 5: 6G Features and Intelligence Surface
Figure 6: RIS Aided Wireless Infrastructure
Figure 7: Global Smart Surface Market 2022-2027
Figure 8: Global Smart Surface Product Average Price 2022-2027
Figure 9: Global Smart Surface Production Volume 2022-2027
Figure 10: Global 6G Communication Smart Surface Market 2030-2035
Table 2: IEEE COMSOC Research Initiatives
Table 3: Global Smart Surface Market by Product Type 2022-2027
Table 4: Global Smart Surface Market by Sensing Type 2022-2027
Table 5: Global Smart Surface Market by Coating Application Layer 2022-2027
Table 6: Global Smart Surface Market by Application Sector 2022-2027
Table 7: Global Smart Surface Market by Industry Vertical 2022-2027
Table 8: Global Smart Surface Market by Region 2022-2027
Table 9: North America Smart Surface Market by Country 2022-2027
Table 10: Europe Smart Surface Market by Country 2022-2027
Table 11: APAC Smart Surface Market by Country 2022-2027
Table 12: MEA Smart Surface Market by Country 2022-2027
Table 13: Latin America Smart Surface Market by Country 2022-2027
Table 14: Global Smart Surface Average Price by Product Type 2022-2027
Table 15: Global Smart Surface Production Volume by Product Type 2022-2027
Table 16: Global Smart Surface Production Volume by Region 2022-2027
Table 17: North America Smart Surface Production Volume by Country 2022-2027
Table 18: Europe Smart Surface Production Volume by Country 2022-2027
Table 19: APAC Smart Surface Production Volume by Country 2022-2027
Table 20: RoW Smart Surface Production Volume by Country 2022-2027
Table 21: Global Smart Surface Product Consumption Volume by Sensing Type 2022-2027
Table 22: Global Smart Surface Product Consumption Volume by Coating Application Layer 2022-2027
Table 23: Global Smart Surface Product Consumption Volume by Application Sector 2022-2027
Table 24: Global Smart Surface Product Consumption Volume by Industry Vertical 2022-2027
Table 25: Global Smart Surface Product Consumption Volume by Region 2022-2027
Table 26: North America Smart Surface Product Consumption Volume by Country 2022-2027
Table 27: Europe Smart Surface Product Consumption Volume by Country 2022-2027
Table 28: APAC Smart Surface Product Consumption Volume by Country 2022-2027
Table 29: MEA Smart Surface Product Consumption Volume by Country 2022-2027
Table 30: Latin America Smart Surface Product Consumption Volume by Country 2022-2027
Table 31: Global 6G Communication Smart Surface Market by Product Type 2030-2035
Table 32: Global 6G Communication Smart Surface Market by Materials Type 2030-2035
Table 33: Global 6G Communication Smart Surface Market by Region 2030-2035
Table 34: North America 6G Communication Smart Surface Market by Country 2030-2035
Table 35: Europe 6G Communication Smart Surface Market by Country 2030-2035
Table 36: APAC 6G Communication Smart Surface Market by Country 2030-2035
Table 37: RoW 6G Communication Smart Surface Market by Country 2030-2035
Companies Mentioned
- 3M Company
- A&K Painting
- ABB
- Active Theory
- Adapta Color S.L.
- Adidas
- Akzonobel
- Alibaba Cloud
- Allerin Tech Pvt. Ltd.
- Altair Engineering, Inc.
- Amazon Web Services
- AnCatt Inc.
- ANSYS
- Apple Inc.
- AT&T
- Atari Inc.
- Aucotec AG
- Autodesk Inc.
- Autotalks
- Axalta Coating Systems
- Baidu
- BASF SE
- Bayer AG
- Bentley Systems, Incorporated
- Binance
- Bloktopia
- Bolly Heroes
- Broadcom Corporation
- ByteDance Ltd.
- CADFEM GmbH
- Cardinal Glass
- China Telecom
- China Unicom
- Cisco Systems
- Cityzenith
- Clariant AG
- ComSenTer (University of California)
- Cope Studio
- Corning Incorporated
- Cosmo Tech
- Cryptovoxels
- DARPA
- Dassault Systems
- Debiotech SA
- Decentraland
- DeepSig
- Denso North America
- Digital Twin Consortium
- Digital Twin Technologies
- DNV GL
- Dow
- DryWired
- DuPont
- DXC Technology
- Eastman Chemical Company
- Eclipse Foundation
- Emerson
- Emesent
- Epic Games Inc.
- Ericsson
- Evonik
- Facebook Connectivity
- Faststream Technologies
- Faurecia
- Federated Wireless
- FEINGUSS BLANK GmbH
- Flowserve
- Forward Networks
- Fujitsu
- Gap Inc
- General Electric
- Gentex Corporation
- Globant
- GoMeta
- Hempel A/S
- Henkel
- Hitachi Ltd.
- Honeywell
- HoYoverse (miHoYo)
- HP
- Huawei
- Hulu LLC
- HyperVerse
- HZO Inc.
- IBM
- Inducoat
- Industrial Internet Consortium
- Industrial Nanotech
- Intellias
- InterDigital
- Invicara
- Johnson Controls
- Jotun A/S
- Kansai Helios
- Karlsruhe Institute of Technology
- KBMax
- Keysight Technologies
- Lanner Electronics
- Larva Labs (Yuga Labs)
- LeewayHertz
- LG Corporation
- Lilith Games
- LOKA
- Magic Leap Inc.
- MediaTek
- Meta Platforms Inc.
- Metahero
- Microsoft
- Microsoft Corporation
- Miru Smart Technologies
- Motorola Solutions
- Nakamoto Games
- Nanoshell Company
- Nanoshine Group Corp.
- NanoShine Ltd.
- Nanotron Technologies (Inpixon Company)
- Nanyang Technological University
- National Instrument Corp.
- National Instruments
- National Science Foundation
- NavVis
- NEC Corporation
- NEI Corporation
- NetEase Inc.
- Netflix
- Nextech AR Solution Corp.
- NextMeet
- NGMN Alliance
- Niantic
- Nike Inc
- Nokia (Bell Labs)
- NTT DoCoMo
- NVidia
- Nvidia Corporation
- NYU Wireless
- OneRare
- Oracle
- Orange
- P2i Limited
- PETRA Data Science
- Physical Web
- PPG Industries
- Pratiti Technologies
- Prodea System Inc.
- PTC
- QiO Technologies
- Qualcomm
- Queppelin
- Rarible
- Reliance Jio Infocomm Limited
- Remcom
- Robert Bosch
- Roblox Corporation
- Royal DSM
- RPM International
- Samsung Electronics
- SAP
- Schneider
- SenSat
- Sherwin-Williams
- Siemens
- Sight Machine Inc.
- Simplifa GmbH
- SK Telecom
- Sky Mavis
- Smart Surfaces Coalition
- Softweb Solutions Inc.
- Sogeti Group
- Somnium Space
- Sony Corporation
- Sorare
- Star Atlas
- Surfactis Technologies
- SWIM.AI
- Synavision
- Sysmex Corporation
- T-Mobile
- Tencent Holdings
- Tesla Nanocoating
- The Lubrizol Corporation
- The Sandbox
- TIBCO Software
- Toshiba Corporation
- TST (Thermal Spray Technologies) Inc.
- TU Braunschweig
- Unity Technologies Inc.
- University of Oulu (6G Flagship)
- UrsaLeo
- Valresa Coating
- Valve
- Verizon
- Verizon Wireless
- View Inc.
- Virginia Diodes
- Virginia Tech
- Virtalis Limited
- Visualiz
- Walmart
- Wipro Limited
- XenonStack
- Zest Labs
- Zippy
- ZQGame
- ZTE
Methodology

LOADING...


