


The vitamin E market is projected to record a CAGR of 4.01% over the forecast period.
The natural product type segment is anticipated to be the fastest growing segment within the global vitamin E market, driven by the tight supply of synthetic vitamin E, which caused a gradual increase in the pricing over the last few years. The primary drivers fueling the growth of the vitamin E market include elements like the rising benefits of vitamin E in the prevention of hair loss and reduction in the possibilities of cardiovascular illnesses. Another significant factor influencing the growth of the vitamin E market is the growing knowledge of the health advantages of vitamins.
Additionally, it is predicted that increased consumer awareness of the risks of vitamin E deficiency, its effectiveness in preventing problems from growing or developing as a result of inactive lifestyles, and the adoption of unhealthy eating habits will accelerate the market's overall expansion. Moreover, the rising demand for functional food and beverages and dietary supplements derived from natural ingredients is further expected to fuel the market for natural vitamin E.
Moreover, the post-COVID-19 awareness level of consumers has grown, and the demand for various fortified food products has increased. This can also be witnessed in the launch of different fortified food products in recent years. Manufacturers in the industries are focusing on developing natural, nutrients rich, and sustainable food products to cater to the growing consumer demand. Furthermore, consumers nowadays look for natural ingredients in products to take care of their day-to-day nutritional needs. Thus, vitamins are expected to see high growth over the forecast period.
This product will be delivered within 2 business days.
The natural product type segment is anticipated to be the fastest growing segment within the global vitamin E market, driven by the tight supply of synthetic vitamin E, which caused a gradual increase in the pricing over the last few years. The primary drivers fueling the growth of the vitamin E market include elements like the rising benefits of vitamin E in the prevention of hair loss and reduction in the possibilities of cardiovascular illnesses. Another significant factor influencing the growth of the vitamin E market is the growing knowledge of the health advantages of vitamins.
Additionally, it is predicted that increased consumer awareness of the risks of vitamin E deficiency, its effectiveness in preventing problems from growing or developing as a result of inactive lifestyles, and the adoption of unhealthy eating habits will accelerate the market's overall expansion. Moreover, the rising demand for functional food and beverages and dietary supplements derived from natural ingredients is further expected to fuel the market for natural vitamin E.
Moreover, the post-COVID-19 awareness level of consumers has grown, and the demand for various fortified food products has increased. This can also be witnessed in the launch of different fortified food products in recent years. Manufacturers in the industries are focusing on developing natural, nutrients rich, and sustainable food products to cater to the growing consumer demand. Furthermore, consumers nowadays look for natural ingredients in products to take care of their day-to-day nutritional needs. Thus, vitamins are expected to see high growth over the forecast period.
Vitamin-E Market Trends
Increasing Demand for Vitamin E in Various Applications
An increasing number of skin care products currently available in the market rely on natural ingredients, including various vitamins and minerals, for maintaining healthy and glowing skin. This has created an immense demand for vitamin E in cosmetic applications. This includes skin products such as sun protection SPF forms incorporating vitamin E and providing UVA and UVB protection. Vitamin E applications in dietary supplements and animal feed have gained importance. The dietary supplements segment witnessed immense growth during the COVID-19 pandemic as these products support the body's immune balance. Even post-COVID-19, the demand for vitamin E has continued due to the above-mentioned factors.
Asia-Pacific is Witnessing the Fastest Growth
The Vitamin market across Asia-Pacific countries is witnessing a rapid change, where consumers are now more aware with regards to the health benefits of several vitamin types. China is the largest producer of vitamin E across the Asia-Pacific market. The country has also expanded its domestic market in recent years, mainly attributable to growing pharmaceutical and dietary supplement markets across the country. Furthermore, in countries such as India, despite an increase in awareness of the importance of several vitamins, only 9% of Indian consumers are aware of the health benefits of vitamin E. While most individuals resort to vitamin E for common ailments, the true potential of vitamin E is held back by a lack of awareness on a large scale.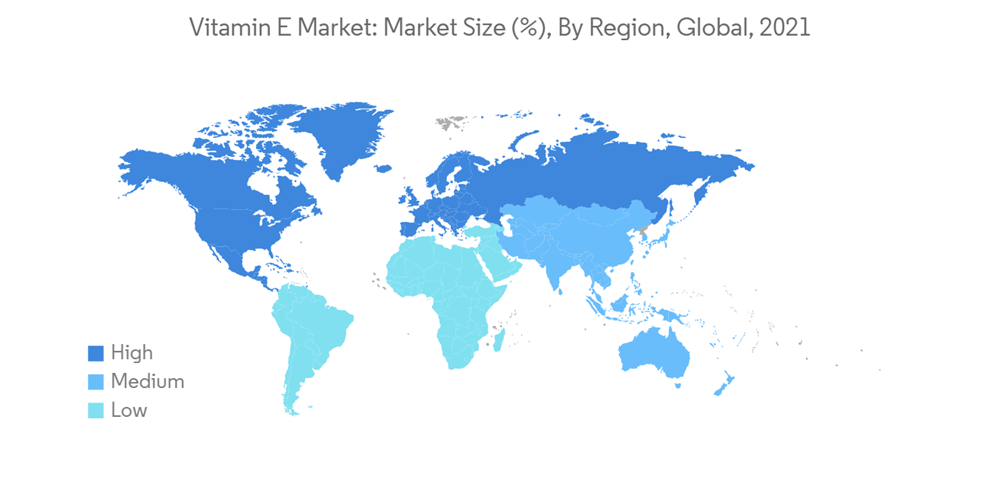
Vitamin-E Market Competitor Analysis
The vitamin-E market is highly competitive, with the presence of various domestic and international players. The market leaders within this industry have adopted competitive strategies to sustain their position in the industry. The major players primarily focus on expansions and product innovations to please different sections of customers, like introducing dietary supplements with fun-filled elements like gummies, jellies, and candies. The major players in the market include Koninklijke DSM NV, BASF SE, ADM, Merck KGaA, and Prinova Group LLC.Additional benefits of purchasing the report:
- The market estimate (ME) sheet in Excel format
- 3 months of analyst support
This product will be delivered within 2 business days.
Table of Contents
1 INTRODUCTION
4 MARKET DYNAMICS
5 MARKET SEGMENTATION
6 COMPETITIVE LANDSCAPE
Companies Mentioned (Partial List)
A selection of companies mentioned in this report includes, but is not limited to:
- BASF SE
- Koninklijke DSM NV
- Archer Daniels Midland Company
- Merck KGaA
- Prinova Group LLC
- Jilin Beisha Pharmaceutical Co. Ltd
- BTSA Biotecnologías Aplicadas SL
- Aryan International
- Orah Nutrichem
- The Bountiful Company


