



The Asia Pacific Visual Cloud Market is expected to reach $90.71 billion by 2032 and is expected to witness market growth of 13.1% CAGR during the forecast period (2025-2032).
The China market dominated the Asia Pacific Visual Cloud Market by country in 2024, and is expected to continue to be a dominant market till 2032; thereby, achieving a market value of $28.53 billion by 2032. The Japan market is registering a CAGR of 12.2% during 2025-2032. Additionally, the India market showcasing a CAGR of 13.8% during 2025-2032. The China and Japan led the Asia Pacific Visual Cloud Market by Country with a market share of 35.4% and 16.4% in 2024. The Malaysia market is expected to witness a CAGR of 16.5% during throughout the forecast period.
The Asia Pacific Visual Cloud Market has grown quickly because of digital transformation in the region, smart city projects, and the growth of cloud and broadband infrastructure. Investing in high-speed internet and data centers early on made it possible to move from on-premises video systems to cloud-based visual platforms that can grow with your needs. With the addition of AI and machine learning, visual data could be turned into real-time insights for things like surveillance, transportation, retail analytics, and industrial inspection. This sped up market growth. The rise of smartphones, IoT devices, and connected cameras has made visual data even more abundant. This means that cloud-based storage, processing, and analytics are necessary in cities with a lot of people.
The market is currently being shaped by the widespread use of AI-powered visual analytics, hybrid and edge-cloud architectures, and smart infrastructure projects led by the government. Increasingly, businesses are using edge computing and centralized cloud platforms together to get low latency and efficient use of bandwidth. Top providers are working with telecom companies, device makers, and governments to build more data centers in different parts of the world, add AI, make things more local, and create developer ecosystems. Competition is still driven by technology and is moderately too highly intense. Global cloud OEMs with strong regional footprints and industry-specific visual cloud solutions are the most important players.
The China market dominated the Asia Pacific Visual Cloud Market by country in 2024, and is expected to continue to be a dominant market till 2032; thereby, achieving a market value of $28.53 billion by 2032. The Japan market is registering a CAGR of 12.2% during 2025-2032. Additionally, the India market showcasing a CAGR of 13.8% during 2025-2032. The China and Japan led the Asia Pacific Visual Cloud Market by Country with a market share of 35.4% and 16.4% in 2024. The Malaysia market is expected to witness a CAGR of 16.5% during throughout the forecast period.
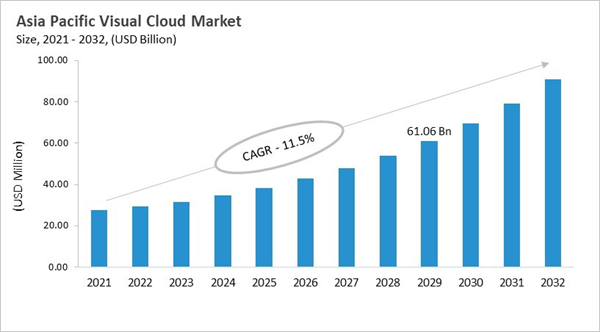
The Asia Pacific Visual Cloud Market has grown quickly because of digital transformation in the region, smart city projects, and the growth of cloud and broadband infrastructure. Investing in high-speed internet and data centers early on made it possible to move from on-premises video systems to cloud-based visual platforms that can grow with your needs. With the addition of AI and machine learning, visual data could be turned into real-time insights for things like surveillance, transportation, retail analytics, and industrial inspection. This sped up market growth. The rise of smartphones, IoT devices, and connected cameras has made visual data even more abundant. This means that cloud-based storage, processing, and analytics are necessary in cities with a lot of people.
The market is currently being shaped by the widespread use of AI-powered visual analytics, hybrid and edge-cloud architectures, and smart infrastructure projects led by the government. Increasingly, businesses are using edge computing and centralized cloud platforms together to get low latency and efficient use of bandwidth. Top providers are working with telecom companies, device makers, and governments to build more data centers in different parts of the world, add AI, make things more local, and create developer ecosystems. Competition is still driven by technology and is moderately too highly intense. Global cloud OEMs with strong regional footprints and industry-specific visual cloud solutions are the most important players.
Application Outlook
Based on Application, the market is segmented into Media Streaming, AI-Based Video Analytics, Cloud Gaming, AR/VR Content Delivery and 3D Rendering & Visualization. The Media Streaming market segment dominated the China Visual Cloud Market by Application is expected to grow at a CAGR of 10.2 % during the forecast period thereby continuing its dominance until 2032. Also, The 3D Rendering & Visualization market is anticipated to grow as a CAGR of 14.3 % during the forecast period during 2025-2032.End User Industry Outlook
Based on End User Industry, the market is segmented into Media & Entertainment, Gaming, Retail & E-Commerce, Manufacturing, Healthcare, Education and Other End Use. Among various Singapore Visual Cloud Market by End User Industry; The Media & Entertainment market achieved a market size of USD $614 Million in 2024 and is expected to grow at a CAGR of 13 % during the forecast period. The Healthcare market is predicted to experience a CAGR of 16.1% throughout the forecast period from (2025-2032).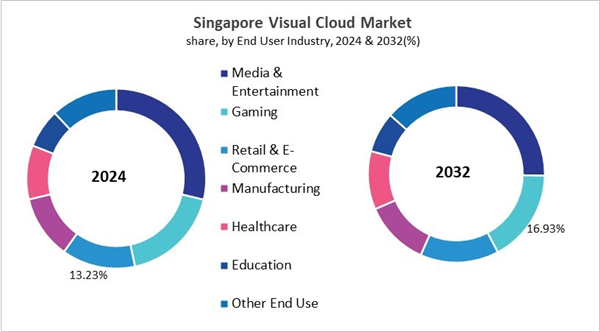
Country Outlook
China is one of the largest and most complex visual cloud markets in the Asia Pacific region, driven by rapid urbanization, a vast digital economy, and strong adoption of artificial intelligence. Visual cloud platforms are widely used across smart city surveillance, video streaming, industrial monitoring, autonomous mobility, and large-scale content delivery. Government-backed smart city programs and investments in AI and digital infrastructure strongly support market growth. High-speed broadband and 5G networks enable low-latency visual services and real-time analytics. The market is dominated by domestic hyperscalers and telecom operators offering integrated cloud, AI, and edge solutions, with continued expansion expected as AI-driven visual technologies deepen across industries.List of Key Companies Profiled
- Microsoft Corporation
- Google LLC (Alphabet Inc.)
- IBM Corporation
- Amazon Web Services, Inc. (Amazon.com, Inc.)
- Oracle Corporation
- Huawei Technologies Co., Ltd. (Huawei Investment & Holding Co., Ltd.)
- VMware, Inc. (Broadcom Inc.)
- Cisco Systems, Inc.
- Salesforce, Inc.
- Rackspace Technology, Inc.
Market Report Segmentation
By Deployment Model- Public Cloud
- Hybrid Cloud
- Private Cloud
- Media Streaming
- AI-Based Video Analytics
- Cloud Gaming
- AR/VR Content Delivery
- 3D Rendering & Visualization
- Cloud Infrastructure as a Service (IaaS)
- Platform as a Service (PaaS)
- Software as a Service (SaaS)
- Edge Cloud Services
- Media & Entertainment
- Gaming
- Retail & E-Commerce
- Manufacturing
- Healthcare
- Education
- Other End Use
- China
- Japan
- India
- South Korea
- Singapore
- Malaysia
- Rest of Asia Pacific
Table of Contents
Chapter 1. Market Scope & Methodology
Chapter 2. Market at a Glance
Chapter 3. Market Overview
Chapter 10. Competition Analysis - Global
Chapter 11. Asia Pacific Visual Cloud Market by Deployment Model
Chapter 12. Asia Pacific Visual Cloud Market by Application
Chapter 13. Asia Pacific Visual Cloud Market by Service Type
Chapter 14. Asia Pacific Visual Cloud Market by End User Industry
Chapter 15. Asia Pacific Visual Cloud Market by Country
Chapter 16. Company Profiles
Companies Mentioned
- Microsoft Corporation
- Google LLC (Alphabet Inc.)
- IBM Corporation
- Amazon Web Services, Inc. (Amazon.com, Inc.)
- Oracle Corporation
- Huawei Technologies Co., Ltd. (Huawei Investment & Holding Co., Ltd.)
- VMware, Inc. (Broadcom Inc.)
- Cisco Systems, Inc.
- Salesforce, Inc.
- Rackspace Technology, Inc.


