+353-1-416-8900REST OF WORLD
+44-20-3973-8888REST OF WORLD
1-917-300-0470EAST COAST U.S
1-800-526-8630U.S. (TOLL FREE)

Global Intrinsically Safe Equipment Market Size, Share & Industry Analysis Report by Class Type, End Use, Zone, Product, Regional Outlook and Forecast, 2025-2032

  • PDF Icon

    Report

  • 657 Pages
  • April 2026
  • Marqual IT Solutions Pvt. Ltd (KBV Research)
  • ID: 6275706
The Global Industrial Data Management Market size is estimated at $117.89 billion in 2025 and is expected to reach $303.79 billion by 2032, rising at a market growth of 14.5% CAGR during the forecast period (2025-2032). The growth of the Industrial Data Management Market is driven by rapid digital transformation across industries and increasing adoption of IoT, cloud computing, and advanced analytics. Organizations are generating vast volumes of operational data and require efficient management systems for storage, integration, and analysis. Rising demand for predictive maintenance, real-time monitoring, and data-driven decision-making further supports strong market expansion.

Key Market Trends & Insights:

  • The North America market dominated Global Industrial Data Management Market in 2024, accounting for a 35.62% revenue share in 2024.
  • The U.S. market is projected to maintain its leadership in North America, reaching a market size of USD 73.96 billion by 2032.
  • Among the various Application, the Predictive Maintenance segment dominated the global market, contributing a revenue share of 20.50% in 2024.
  • In terms of Solution Type, Data Storage & Integration segment is expected to lead the global market, with a projected revenue share of 27.00% by 2032.
  • Manufacturing & Processing emerged as the leading End Use in 2024, capturing a 32.70% share, and is projected to retain its dominance during the forecast period.


The industrial data management market has become a foundational component of digital transformation across industry verticals, developing into advanced, integrated data management frameworks. The rapid adoption of sensors, IoT devices, and automated machinery has generated large volumes of industrial data, fuelling the demand for systems capable of efficient data collection, analysis, and storage. These solutions improve visibility into operations like equipment performance, manufacturing processes, and supply chain activities, while also assuring regulatory compliance. Advancements in edge and cloud computing have strengthened the market by allowing flexible, scalable, and real-time data processing, helping enterprises enhance operational efficiency and allow predictive maintenance.

Key trends shaping the industrial data management market include the rising integration of machine learning and AI into industrial data platforms, allowing advanced capabilities such as predictive analytics, process optimization, and anomaly detection. Data sovereignty concerns and rising regulatory requirements are influencing how enterprises secure and manage industrial data. Enterprises are largely adopting compliant and secure data strategies while leveraging edge computing to support real-time decision-making and reduce latency. Market leaders are focusing on strategic partnerships, innovation, and customer-centric solutions to stay competitive in this rapidly growing market.

The major strategies followed by the market participants are Partnerships as the key developmental strategy to keep pace with the changing demands of end users. For instance, In May, 2025, Amazon Web Services, Inc. announced the partnership with Boomi, a software company to enhance enterprise AI integration, automation, and SAP cloud migration. By combining Boomi’s Agent Control Tower with Amazon Bedrock, the partnership offers centralized AI agent governance, advanced integration tools, and native AWS connectors to streamline operations and accelerate secure, scalable digital transformation. Additionally, In May, 2025, IBM Corporation teamed up with Oracle, a computer software company to integrate IBM’s watsonx AI and Granite models with Oracle Cloud Infrastructure. This collaboration enables enterprise-scale agentic AI workflows, hybrid cloud deployment, and advanced data management. It also includes IBM software and consulting services to support AI adoption, automation, and business transformation.

KBV Cardinal Matrix - Market Competition Analysis


Based on the Analysis presented in the KBV Cardinal matrix; Google LLC, Microsoft Corporation, Amazon Web Services, Inc. are the forerunners in the Industrial Data Management Market. Companies such as Oracle Corporation, Siemens AG, and IBM Corporation are some of the key innovators in Industrial Data Management Market. In May, 2025, Microsoft Corporation announced the partnership with Informatica, a software company to accelerate AI-powered cloud data management adoption. By integrating Informatica’s Intelligent Data Management Cloud with Microsoft Azure and Fabric, the partnership enables enterprises to streamline analytics, improve data governance, and scale AI initiatives across their data infrastructure.

COVID-19 Impact Analysis

The COVID-19 pandemic hurt the Industrial Data Management Market in the first part of 2020 because lockdowns made it hard for important industries like manufacturing, oil and gas, and energy to keep working. A lot of businesses cut back on capital spending and put off digital transformation projects because they weren't sure about their finances. Disruptions in the supply chain made hardware, system integration, and implementation services harder to get, which slowed down project execution. Travel restrictions also made it harder to do deployment and maintenance work on-site. Also, problems with the infrastructure and cybersecurity were made worse by disruptions to the workforce and the sudden switch to remote work. These things made it take longer for businesses to start using and growing industrial data management solutions during the pandemic.

Driving and Restraining Factors

Drivers
  • Increasing Complexity and Volume of Industrial Data
  • Adoption of Advanced Analytics and Artificial Intelligence
  • Regulatory Compliance and Data Governance Requirements
  • Growth of Cloud Computing and Managed Data Services in Industry
Restraints
  • High Complexity and Integration Challenges
  • Cybersecurity Risks and Data Privacy Concerns
  • Limited Skilled Workforce and Expertise Gaps
Opportunities
  • Industrial Data Integration and Interoperability Enhancement
  • AI-Driven Predictive Analytics and Automation Solutions
  • Cloud and Edge Hybrid Architectures for Scalable Industrial Data Solutions
Challenges
  • Integration Complexity and Legacy Systems in Industrial Data Management
  • Data Quality and Governance Issues in Industrial Data Management
  • Skilled Workforce Shortage and Change Management Challenges

Market Share Analysis


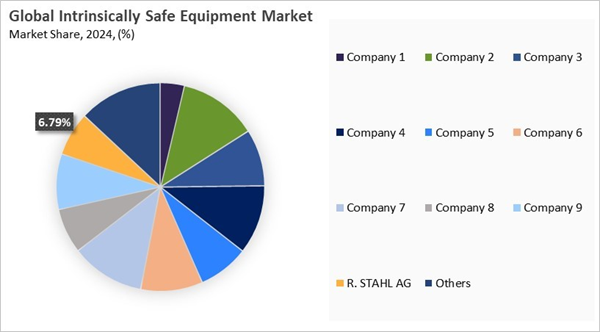
The leading players in the market are competing with diverse innovative offerings to remain competitive in the market. The above illustration shows the percentage of revenue shared by some of the leading companies in the market. The leading players of the market are adopting various strategies to cater demand coming from the different industries. The key developmental strategies in the market are Acquisitions, and Partnerships & Collaborations.

Data type Outlook

Based on data type, the industrial data management market is characterized into structured data, unstructured data, and semi-structured data. The unstructured data segment attained 36% revenue share in the industrial data management market in 2024.  The unstructured data segment is expanding rapidly as industries generate large volumes of data from sources such as sensors, machine logs, video feeds, and communication platforms. Unlike structured data, this data does not follow a predefined format, making it more complex to store, process, and analyze.

End Use Outlook

On the basis of end use, the industrial data management market is classified into manufacturing & processing, energy & utilities, logistics & supply chain, BFSI, and healthcare & others. The energy & utilities segment recorded 21% revenue share in the industrial data management market in 2024.  The energy and utilities segment is witnessing strong adoption of industrial data management solutions as organizations focus on improving efficiency, reliability, and sustainability. The increasing shift toward renewable energy, smart grids, and digitalized energy infrastructure has led to a surge in data generation across the sector.


Regional Outlook

Region-wise, the Industrial Data Management Market is analyzed across North America, Europe, Asia Pacific, and LAMEA. The North America segment holds 35.62% share in the Market. The industrial data management market is anticipated to grow at a significant rate in the North America and Europe regions. The market is supported by strong regulatory frameworks, advanced technological adoption, and mature industrial ecosystems. The North America market is growing because of the widespread implementation of Industry 4.0 practices, the presence of major technology providers, and high investment in edge and cloud computing. The regions’ emphasis on predictive maintenance, digital transformation, and cybersecurity further surges the market expansion. Furthermore, Europe industrial data management market is predicted to capture noticeable growth. The market is driven by strict data protection regulations like GDPR, which shape how industrial data is processed, shared, and stored. Further, European industries prioritize smart manufacturing, sustainability, and cross-border data interoperability, and support the adoption of robust data management solutions across industries like energy, automotive, and manufacturing.

In the Asia Pacific and LAMEA regions, the industrial data management market is estimated to experience prominent growth. This is because of expanding manufacturing bases, rising government initiatives supporting digital transformation, and accelerating industrialization. Nations such as South Korea, India, Japan, and China are largely investing in industrial automation and smart factories, raising demand for scalable data management platforms. Moreover, the LAMEA industrial data management market is witnessing lucrative market opportunities. The market is supported by rising awareness of digital technologies and infrastructure development. Rising investments in industry verticals such as mining, utilities, and oil & gas are creating lucrative opportunities for industrial data management solutions.

Market Competition and Attributes


The Industrial Data Management Market is highly competitive, driven by continuous technological innovation and the growing demand for efficient data handling across industries. Companies compete by offering advanced solutions integrating cloud computing, artificial intelligence, and IoT capabilities to improve real-time data processing and analytics. Vendors focus on product development, scalable platforms, and enhanced cybersecurity features to attract customers. Strategic partnerships, service expansion, and customized industry solutions are commonly used to strengthen market position, while new entrants introduce innovative tools that further intensify competition.

Recent Strategies Deployed in the Market

  • Jun-2025: Snowflake Inc. unveiling Gen2 Standard Warehouses for 2.1x faster analytics and Adaptive Compute for automated, efficient resource management. It also introduced AI-driven governance, enhanced data discovery, interoperability, and observability tools - empowering businesses to scale, secure, and optimize their data environments in the AI era.
  • Jun-2025: Snowflake Inc. unveiled new AI-driven data management tools, including Snowflake Openflow, Adaptive Compute, and Snowflake Intelligence. These innovations aim to streamline data integration, boost compute efficiency, and democratize AI insights - empowering organizations to transform workflows, enhance decision-making, and accelerate enterprise-wide digital transformation in the AI era.
  • Jun-2025: Snowflake Inc. acquired Crunchy Data, a PostgreSQL-focused startup, to enhance its database capabilities and launch Snowflake Postgres. This move supports Snowflake’s AI data platform strategy, giving enterprise customers robust Postgres tools and expanding its presence in the $350 billion data and AI market. Terms of the deal remain undisclosed.
  • Jun-2025: Siemens AG teamed up with NVIDIA, a computer manufacturer corporation to accelerate AI capabilities in manufacturing, integrating NVIDIA’s AI and accelerated computing with Siemens’ Xcelerator platform. This collaboration enables AI-powered factory automation, real-time data insights, and improved operational efficiency, driving digital transformation and innovation across industrial manufacturing globally.
  • May-2025: IBM Corporation unveiled new hybrid AI technologies to help enterprises build AI agents using their own data. Highlights include watsonx Orchestrate’s AI agent tools, webMethods Hybrid Integration for app orchestration, and enhanced watsonx.data for managing unstructured data - driving scalable, secure AI across hybrid clouds.

List of Key Companies Profiled

  • Microsoft Corporation
  • Amazon Web Services, Inc. (Amazon.com, Inc.)
  • IBM Corporation
  • SAP SE
  • Oracle Corporation
  • Informatica Inc.
  • Google LLC
  • Snowflake Inc.
  • Siemens AG
  • Honeywell International, Inc.

Market Report Segmentation

By Data Type
  • Structured Data
  • Unstructured Data
  • Semi-Structured Data
By End Use
  • Manufacturing & Processing
  • Energy & Utilities
  • Logistics & Supply Chain
  • BFSI
  • Healthcare & Others
By Solution Type
  • Data Storage & Integration
  • Data Orchestration & Analytics
  • Data Visualization
  • Data Security
  • Data Governance & Compliance
  • Data Sharing
By Application
  • Predictive Maintenance
  • Asset Monitoring & Optimization
  • Manufacturing Process Optimization
  • Real-Time Operational Analytics
  • Supply Chain & Inventory Management
  • Regulatory Reporting & Compliance
  • Other Application
By Geography
  • North America
    • US
    • Canada
    • Mexico
    • Rest of North America

  • Europe
    • Germany
    • UK
    • France
    • Russia
    • Spain
    • Italy
    • Rest of Europe

  • Asia Pacific
    • China
    • Japan
    • India
    • South Korea
    • Singapore
    • Malaysia
    • Rest of Asia Pacific

  • LAMEA
    • Brazil
    • Argentina
    • UAE
    • Saudi Arabia
    • South Africa
    • Nigeria
    • Rest of LAMEA

Table of Contents

Chapter 1. Market Scope & Methodology
1.1 Market Definition
1.2 Objectives
1.3 Market Scope
1.4 Segmentation
1.4.1 Global Intrinsically Safe Equipment Market, by Class Type
1.4.2 Global Intrinsically Safe Equipment Market, by End Use
1.4.3 Global Intrinsically Safe Equipment Market, by Zone
1.4.4 Global Intrinsically Safe Equipment Market, by Product
1.4.5 Global Intrinsically Safe Equipment Market, by Geography
1.5 Methodology for the Research
Chapter 2. Market at a Glance
2.1 Key Highlights
Chapter 3. Market Overview
3.1 Introduction
3.1.1 Overview
3.1.1.1 Market Composition and Scenario
3.2 Key Factors Impacting the Market
3.2.1 Market Drivers
3.2.2 Market Restraints
3.2.3 Market Opportunities
3.2.4 Market Challenges
Chapter 4. Market Trends - Global Intrinsically Safe Equipment Market
4.1 Overview
4.2 Key Market Trends
Chapter 5. State of Competition - Global Intrinsically Safe Equipment Market
5.1 Overview
5.2 Key Competitive Factors
Chapter 6. Market Consolidation - Global Intrinsically Safe Equipment Market
6.1 Overview
6.2 Key Market Consolidation Factors
Chapter 7. Key Customer Criteria - Global Intrinsically Safe Equipment Market
7.1 Overview
7.2 Key Customer Criteria
Chapter 8. Product Life Cycle - Global Intrinsically Safe Equipment Market
8.1 Overview
8.2 Introduction Stage
8.3 Growth Stage
8.4 Maturity Stage
8.5 Decline Stage
Chapter 9. Value Chain Analysis of Intrinsically Safe Equipment Market
9.1 Overview
9.2 Stages of Value Chain
Chapter 10. Competition Analysis - Global
10.1 Market Share Analysis, 2024
10.2 Recent Strategies Deployed in Intrinsically Safe Equipment Market
10.3 Porter Five Forces Analysis
Chapter 11. Global Intrinsically Safe Equipment Market by Class Type
11.1 Global Class 1 Market by Region
11.2 Global Class 2 Market by Region
11.3 Global Class 3 Market by Region
Chapter 12. Global Intrinsically Safe Equipment Market by End Use
12.1 Global Oil & Gas Market by Region
12.2 Global Chemical & Petrochemical Market by Region
12.3 Global Mining Market by Region
12.4 Global Power Market by Region
12.5 Global Processing Industries & Other Market by Region
Chapter 13. Global Intrinsically Safe Equipment Market by Zone
13.1 Global Zone 1 Market by Region
13.2 Global Zone 2 Market by Region
13.3 Global Zone 22 Market by Region
13.4 Global Zone 0 Market by Region
13.5 Global Zone 21 Market by Region
13.6 Global Zone 20 Market by Region
Chapter 14. Global Intrinsically Safe Equipment Market by Product
14.1 Global Sensors Market by Region
14.2 Global Detectors Market by Region
14.3 Global Transmitters Market by Region
14.4 Global Isolators / Barriers Market by Region
14.5 Global Switches Market by Region
14.6 Global LED Indicators Market by Region
14.7 Global Other Product Market by Region
Chapter 15. Global Intrinsically Safe Equipment Market by Region
15.1 North America Intrinsically Safe Equipment Market
15.1.1 Key Factors Impacting the Market
15.1.1.1 Market Drivers
15.1.1.2 Market Restraints
15.1.1.3 Market Opportunities
15.1.1.4 Market Challenges
15.1.2 Market Trends - North America Intrinsically Safe Equipment Market
15.1.2.1 Overview
15.1.2.2 Key Market Trends
15.1.3 State of Competition - North America Intrinsically Safe Equipment Market
15.1.3.1 Overview
15.1.3.2 Key Competitive Factors
15.1.4 Market Consolidation - North America Intrinsically Safe Equipment Market
15.1.4.1 Overview
15.1.4.2 Key Market Consolidation Factors
15.1.5 Key Customer Criteria - North America Intrinsically Safe Equipment Market
15.1.5.1 Overview
15.1.5.2 Key Market Consolidation Factors
15.1.6 Product Life Cycle - North America Intrinsically Safe Equipment Market
15.1.6.1 Overview
15.1.6.2 Introduction Stage
15.1.6.3 Growth Stage
15.1.6.4 Maturity Stage
15.1.6.5 Decline Stage
15.1.7 North America Intrinsically Safe Equipment Market by Class Type
15.1.7.1 North America Class 1 Market by Country
15.1.7.2 North America Class 2 Market by Country
15.1.7.3 North America Class 3 Market by Country
15.1.8 North America Intrinsically Safe Equipment Market by End Use
15.1.8.1 North America Oil & Gas Market by Region
15.1.8.2 North America Chemical & Petrochemical Market by Region
15.1.8.3 North America Mining Market by Region
15.1.8.4 North America Power Market by Region
15.1.8.5 North America Processing Industries & Other Market by Region
15.1.9 North America Intrinsically Safe Equipment Market by Zone
15.1.9.1 North America Zone 1 Market by Country
15.1.9.2 North America Zone 2 Market by Country
15.1.9.3 North America Zone 22 Market by Country
15.1.9.4 North America Zone 0 Market by Country
15.1.9.5 North America Zone 21 Market by Country
15.1.9.6 North America Zone 20 Market by Country
15.1.10 North America Intrinsically Safe Equipment Market by Product
15.1.10.1 North America Sensors Market by Country
15.1.10.2 North America Detectors Market by Country
15.1.10.3 North America Transmitters Market by Country
15.1.10.4 North America Isolators / Barriers Market by Country
15.1.10.5 North America Switches Market by Country
15.1.10.6 North America LED Indicators Market by Country
15.1.10.7 North America Other Product Market by Country
15.1.11 North America Intrinsically Safe Equipment Market by Country
15.1.11.1 US Intrinsically Safe Equipment Market
15.1.11.1.1 US Intrinsically Safe Equipment Market by Class Type
15.1.11.1.2 US Intrinsically Safe Equipment Market by End Use
15.1.11.1.3 US Intrinsically Safe Equipment Market by Zone
15.1.11.1.4 US Intrinsically Safe Equipment Market by Product
15.1.11.2 Canada Intrinsically Safe Equipment Market
15.1.11.2.1 Canada Intrinsically Safe Equipment Market by Class Type
15.1.11.2.2 Canada Intrinsically Safe Equipment Market by End Use
15.1.11.2.3 Canada Intrinsically Safe Equipment Market by Zone
15.1.11.2.4 Canada Intrinsically Safe Equipment Market by Product
15.1.11.3 Mexico Intrinsically Safe Equipment Market
15.1.11.3.1 Mexico Intrinsically Safe Equipment Market by Class Type
15.1.11.3.2 Mexico Intrinsically Safe Equipment Market by End Use
15.1.11.3.3 Mexico Intrinsically Safe Equipment Market by Zone
15.1.11.3.4 Mexico Intrinsically Safe Equipment Market by Product
15.1.11.4 Rest of North America Intrinsically Safe Equipment Market
15.1.11.4.1 Rest of North America Intrinsically Safe Equipment Market by Class Type
15.1.11.4.2 Rest of North America Intrinsically Safe Equipment Market by End Use
15.1.11.4.3 Rest of North America Intrinsically Safe Equipment Market by Zone
15.1.11.4.4 Rest of North America Intrinsically Safe Equipment Market by Product
15.2 Europe Intrinsically Safe Equipment Market
15.2.1 Key Factors Impacting the Market
15.2.1.1 Market Drivers
15.2.1.2 Market Restraints
15.2.1.3 Market Opportunities
15.2.1.4 Market Challenges
15.2.2 Market Trends - Europe Intrinsically Safe Equipment Market
15.2.2.1 Overview
15.2.2.2 Key Market Trends
15.2.3 State of Competition - Europe Intrinsically Safe Equipment Market
15.2.3.1 Overview
15.2.3.2 Key Competitive Factors
15.2.4 Market Consolidation - Europe Intrinsically Safe Equipment Market
15.2.4.1 Overview
15.2.4.2 Key Market Consolidation Factors
15.2.5 Key Customer Criteria - Europe Intrinsically Safe Equipment Market
15.2.5.1 Overview
15.2.5.2 Key Customer Criteria
15.2.6 Product Life Cycle - Europe Intrinsically Safe Equipment Market
15.2.6.1 Overview
15.2.6.2 Introduction Stage
15.2.6.3 Growth Stage
15.2.6.4 Maturity Stage
15.2.6.5 Decline Stage
15.2.7 Europe Intrinsically Safe Equipment Market by Class Type
15.2.7.1 Europe Class 1 Market by Country
15.2.7.2 Europe Class 2 Market by Country
15.2.7.3 Europe Class 3 Market by Country
15.2.8 Europe Intrinsically Safe Equipment Market by End Use
15.2.8.1 Europe Oil & Gas Market by Country
15.2.8.2 Europe Chemical & Petrochemical Market by Country
15.2.8.3 Europe Mining Market by Country
15.2.8.4 Europe Power Market by Country
15.2.8.5 Europe Processing Industries & Other Market by Country
15.2.9 Europe Intrinsically Safe Equipment Market by Zone
15.2.9.1 Europe Zone 1 Market by Country
15.2.9.2 Europe Zone 2 Market by Country
15.2.9.3 Europe Zone 22 Market by Country
15.2.9.4 Europe Zone 0 Market by Country
15.2.9.5 Europe Zone 21 Market by Country
15.2.9.6 Europe Zone 20 Market by Country
15.2.10 Europe Intrinsically Safe Equipment Market by Product
15.2.10.1 Europe Sensors Market by Country
15.2.10.2 Europe Detectors Market by Country
15.2.10.3 Europe Transmitters Market by Country
15.2.10.4 Europe Isolators / Barriers Market by Country
15.2.10.5 Europe Switches Market by Country
15.2.10.6 Europe LED Indicators Market by Country
15.2.10.7 Europe Other Product Market by Country
15.2.11 Europe Intrinsically Safe Equipment Market by Country
15.2.11.1 Germany Intrinsically Safe Equipment Market
15.2.11.1.1 Germany Intrinsically Safe Equipment Market by Class Type
15.2.11.1.2 Germany Intrinsically Safe Equipment Market by End Use
15.2.11.1.3 Germany Intrinsically Safe Equipment Market by Zone
15.2.11.1.4 Germany Intrinsically Safe Equipment Market by Product
15.2.11.2 UK Intrinsically Safe Equipment Market
15.2.11.2.1 UK Intrinsically Safe Equipment Market by Class Type
15.2.11.2.2 UK Intrinsically Safe Equipment Market by End Use
15.2.11.2.3 UK Intrinsically Safe Equipment Market by Zone
15.2.11.2.4 UK Intrinsically Safe Equipment Market by Product
15.2.11.3 France Intrinsically Safe Equipment Market
15.2.11.3.1 France Intrinsically Safe Equipment Market by Class Type
15.2.11.3.2 France Intrinsically Safe Equipment Market by End Use
15.2.11.3.3 France Intrinsically Safe Equipment Market by Zone
15.2.11.3.4 France Intrinsically Safe Equipment Market by Product
15.2.11.4 Russia Intrinsically Safe Equipment Market
15.2.11.4.1 Russia Intrinsically Safe Equipment Market by Class Type
15.2.11.4.2 Russia Intrinsically Safe Equipment Market by End Use
15.2.11.4.3 Russia Intrinsically Safe Equipment Market by Zone
15.2.11.4.4 Russia Intrinsically Safe Equipment Market by Product
15.2.11.5 Spain Intrinsically Safe Equipment Market
15.2.11.5.1 Spain Intrinsically Safe Equipment Market by Class Type
15.2.11.5.2 Spain Intrinsically Safe Equipment Market by End Use
15.2.11.5.3 Spain Intrinsically Safe Equipment Market by Zone
15.2.11.5.4 Spain Intrinsically Safe Equipment Market by Product
15.2.11.6 Italy Intrinsically Safe Equipment Market
15.2.11.6.1 Italy Intrinsically Safe Equipment Market by Class Type
15.2.11.6.2 Italy Intrinsically Safe Equipment Market by End Use
15.2.11.6.3 Italy Intrinsically Safe Equipment Market by Zone
15.2.11.6.4 Italy Intrinsically Safe Equipment Market by Product
15.2.11.7 Rest of Europe Intrinsically Safe Equipment Market
15.2.11.7.1 Rest of Europe Intrinsically Safe Equipment Market by Class Type
15.2.11.7.2 Rest of Europe Intrinsically Safe Equipment Market by End Use
15.2.11.7.3 Rest of Europe Intrinsically Safe Equipment Market by Zone
15.2.11.7.4 Rest of Europe Intrinsically Safe Equipment Market by Product
15.3 Asia Pacific Intrinsically Safe Equipment Market
15.3.1 Key Factors Impacting the Market
15.3.1.1 Market Drivers
15.3.1.2 Market Restraints
15.3.1.3 Market Opportunities
15.3.1.4 Market Challenges
15.3.2 Market Trends - Asia Pacific Intrinsically Safe Equipment Market
15.3.2.1 Overview
15.3.2.2 Key Market Trends
15.3.3 State of Competition - Asia Pacific Intrinsically Safe Equipment Market
15.3.3.1 Overview
15.3.3.2 Key Competitive Factors
15.3.4 Market Consolidation - Asia Pacific Intrinsically Safe Equipment Market
15.3.4.1 Overview
15.3.4.2 Key Market Consolidation Factors
15.3.5 Key Customer Criteria - Asia Pacific Intrinsically Safe Equipment Market
15.3.5.1 Overview
15.3.5.2 Key Customer Criteria
15.3.6 Product Life Cycle - Asia Pacific Intrinsically Safe Equipment Market
15.3.6.1 Overview
15.3.6.2 Introduction Stage
15.3.6.3 Growth Stage
15.3.6.4 Maturity Stage
15.3.6.5 Decline Stage
15.3.7 Asia Pacific Intrinsically Safe Equipment Market by Class Type
15.3.7.1 Asia Pacific Class 1 Market by Country
15.3.7.2 Asia Pacific Class 2 Market by Country
15.3.7.3 Asia Pacific Class 3 Market by Country
15.3.8 Asia Pacific Intrinsically Safe Equipment Market by End Use
15.3.8.1 Asia Pacific Oil & Gas Market by Country
15.3.8.2 Asia Pacific Chemical & Petrochemical Market by Country
15.3.8.3 Asia Pacific Mining Market by Country
15.3.8.4 Asia Pacific Power Market by Country
15.3.8.5 Asia Pacific Processing Industries & Other Market by Country
15.3.9 Asia Pacific Intrinsically Safe Equipment Market by Zone
15.3.9.1 Asia Pacific Zone 1 Market by Country
15.3.9.2 Asia Pacific Zone 2 Market by Country
15.3.9.3 Asia Pacific Zone 22 Market by Country
15.3.9.4 Asia Pacific Zone 0 Market by Country
15.3.9.5 Asia Pacific Zone 21 Market by Country
15.3.9.6 Asia Pacific Zone 20 Market by Country
15.3.10 Asia Pacific Intrinsically Safe Equipment Market by Product
15.3.10.1 Asia Pacific Sensors Market by Country
15.3.10.2 Asia Pacific Detectors Market by Country
15.3.10.3 Asia Pacific Transmitters Market by Country
15.3.10.4 Asia Pacific Isolators / Barriers Market by Country
15.3.10.5 Asia Pacific Switches Market by Country
15.3.10.6 Asia Pacific LED Indicators Market by Country
15.3.10.7 Asia Pacific Other Product Market by Country
15.3.11 Asia Pacific Intrinsically Safe Equipment Market by Country
15.3.11.1 China Intrinsically Safe Equipment Market
15.3.11.1.1 China Intrinsically Safe Equipment Market by Class Type
15.3.11.1.2 China Intrinsically Safe Equipment Market by End Use
15.3.11.1.3 China Intrinsically Safe Equipment Market by Zone
15.3.11.1.4 China Intrinsically Safe Equipment Market by Product
15.3.11.2 Japan Intrinsically Safe Equipment Market
15.3.11.2.1 Japan Intrinsically Safe Equipment Market by Class Type
15.3.11.2.2 Japan Intrinsically Safe Equipment Market by End Use
15.3.11.2.3 Japan Intrinsically Safe Equipment Market by Zone
15.3.11.2.4 Japan Intrinsically Safe Equipment Market by Product
15.3.11.3 India Intrinsically Safe Equipment Market
15.3.11.3.1 India Intrinsically Safe Equipment Market by Class Type
15.3.11.3.2 India Intrinsically Safe Equipment Market by End Use
15.3.11.3.3 India Intrinsically Safe Equipment Market by Zone
15.3.11.3.4 India Intrinsically Safe Equipment Market by Product
15.3.11.4 South Korea Intrinsically Safe Equipment Market
15.3.11.4.1 South Korea Intrinsically Safe Equipment Market by Class Type
15.3.11.4.2 South Korea Intrinsically Safe Equipment Market by End Use
15.3.11.4.3 South Korea Intrinsically Safe Equipment Market by Zone
15.3.11.4.4 South Korea Intrinsically Safe Equipment Market by Product
15.3.11.5 Singapore Intrinsically Safe Equipment Market
15.3.11.5.1 Singapore Intrinsically Safe Equipment Market by Class Type
15.3.11.5.2 Singapore Intrinsically Safe Equipment Market by End Use
15.3.11.5.3 Singapore Intrinsically Safe Equipment Market by Zone
15.3.11.5.4 Singapore Intrinsically Safe Equipment Market by Product
15.3.11.6 Malaysia Intrinsically Safe Equipment Market
15.3.11.6.1 Malaysia Intrinsically Safe Equipment Market by Class Type
15.3.11.6.2 Malaysia Intrinsically Safe Equipment Market by End Use
15.3.11.6.3 Malaysia Intrinsically Safe Equipment Market by Zone
15.3.11.6.4 Malaysia Intrinsically Safe Equipment Market by Product
15.3.11.7 Rest of Asia Pacific Intrinsically Safe Equipment Market
15.3.11.7.1 Rest of Asia Pacific Intrinsically Safe Equipment Market by Class Type
15.3.11.7.2 Rest of Asia Pacific Intrinsically Safe Equipment Market by End Use
15.3.11.7.3 Rest of Asia Pacific Intrinsically Safe Equipment Market by Zone
15.3.11.7.4 Rest of Asia Pacific Intrinsically Safe Equipment Market by Product
15.4 LAMEA Intrinsically Safe Equipment Market
15.4.1 Key Factors Impacting the Market
15.4.1.1 Market Drivers
15.4.1.2 Market Restraints
15.4.1.3 Market Opportunities
15.4.1.4 Market Challenges
15.4.2 Market Trends - LAMEA Intrinsically Safe Equipment Market
15.4.2.1 Overview
15.4.2.2 Key Market Trends
15.4.3 State Of Competition - LAMEA Intrinsically Safe Equipment Market
15.4.3.1 Overview
15.4.3.2 Key Competitive Factors
15.4.4 Market Consolidation - Intrinsically Safe Equipment Market
15.4.4.1 Overview
15.4.4.2 Key Market Consolidation Factors
15.4.5 Key Customer Criteria - LAMEA Intrinsically Safe Equipment Market
15.4.5.1 Overview
15.4.5.2 Key Customer Criteria
15.4.6 Product Life Cycle - LAMEA Intrinsically Safe Equipment Market
15.4.6.1 Overview
15.4.6.2 Introduction Stage
15.4.6.3 Growth Stage
15.4.6.4 Maturity Stage
15.4.6.5 Decline Stage
15.4.7 LAMEA Intrinsically Safe Equipment Market by Class Type
15.4.7.1 LAMEA Class 1 Market by Country
15.4.7.2 LAMEA Class 2 Market by Country
15.4.7.3 LAMEA Class 3 Market by Country
15.4.8 LAMEA Intrinsically Safe Equipment Market by End Use
15.4.8.1 LAMEA Oil & Gas Market by Country
15.4.8.2 LAMEA Chemical & Petrochemical Market by Country
15.4.8.3 LAMEA Mining Market by Country
15.4.8.4 LAMEA Power Market by Country
15.4.8.5 LAMEA Processing Industries & Other Market by Country
15.4.9 LAMEA Intrinsically Safe Equipment Market by Zone
15.4.9.1 LAMEA Zone 1 Market by Country
15.4.9.2 LAMEA Zone 2 Market by Country
15.4.9.3 LAMEA Zone 22 Market by Country
15.4.9.4 LAMEA Zone 0 Market by Country
15.4.9.5 LAMEA Zone 21 Market by Country
15.4.9.6 LAMEA Zone 20 Market by Country
15.4.10 LAMEA Intrinsically Safe Equipment Market by Product
15.4.10.1 LAMEA Sensors Market by Country
15.4.10.2 LAMEA Detectors Market by Country
15.4.10.3 LAMEA Transmitters Market by Country
15.4.10.4 LAMEA Isolators / Barriers Market by Country
15.4.10.5 LAMEA Switches Market by Country
15.4.10.6 LAMEA LED Indicators Market by Country
15.4.10.7 LAMEA Other Product Market by Country
15.4.11 LAMEA Intrinsically Safe Equipment Market by Country
15.4.11.1 Brazil Intrinsically Safe Equipment Market
15.4.11.1.1 Brazil Intrinsically Safe Equipment Market by Class Type
15.4.11.1.2 Brazil Intrinsically Safe Equipment Market by End Use
15.4.11.1.3 Brazil Intrinsically Safe Equipment Market by Zone
15.4.11.1.4 Brazil Intrinsically Safe Equipment Market by Product
15.4.11.2 Argentina Intrinsically Safe Equipment Market
15.4.11.2.1 Argentina Intrinsically Safe Equipment Market by Class Type
15.4.11.2.2 Argentina Intrinsically Safe Equipment Market by End Use
15.4.11.2.3 Argentina Intrinsically Safe Equipment Market by Zone
15.4.11.2.4 Argentina Intrinsically Safe Equipment Market by Product
15.4.11.3 UAE Intrinsically Safe Equipment Market
15.4.11.3.1 UAE Intrinsically Safe Equipment Market by Class Type
15.4.11.3.2 UAE Intrinsically Safe Equipment Market by End Use
15.4.11.3.3 UAE Intrinsically Safe Equipment Market by Zone
15.4.11.3.4 UAE Intrinsically Safe Equipment Market by Product
15.4.11.4 Saudi Arabia Intrinsically Safe Equipment Market
15.4.11.4.1 Saudi Arabia Intrinsically Safe Equipment Market by Class Type
15.4.11.4.2 Saudi Arabia Intrinsically Safe Equipment Market by End Use
15.4.11.4.3 Saudi Arabia Intrinsically Safe Equipment Market by Zone
15.4.11.4.4 Saudi Arabia Intrinsically Safe Equipment Market by Product
15.4.11.5 South Africa Intrinsically Safe Equipment Market
15.4.11.5.1 South Africa Intrinsically Safe Equipment Market by Class Type
15.4.11.5.2 South Africa Intrinsically Safe Equipment Market by End Use
15.4.11.5.3 South Africa Intrinsically Safe Equipment Market by Zone
15.4.11.5.4 South Africa Intrinsically Safe Equipment Market by Product
15.4.11.6 Nigeria Intrinsically Safe Equipment Market
15.4.11.6.1 Nigeria Intrinsically Safe Equipment Market by Class Type
15.4.11.6.2 Nigeria Intrinsically Safe Equipment Market by End Use
15.4.11.6.3 Nigeria Intrinsically Safe Equipment Market by Zone
15.4.11.6.4 Nigeria Intrinsically Safe Equipment Market by Product
15.4.11.7 Rest of LAMEA Intrinsically Safe Equipment Market
15.4.11.7.1 Rest of LAMEA Intrinsically Safe Equipment Market by Class Type
15.4.11.7.2 Rest of LAMEA Intrinsically Safe Equipment Market by End Use
15.4.11.7.3 Rest of LAMEA Intrinsically Safe Equipment Market by Zone
15.4.11.7.4 Rest of LAMEA Intrinsically Safe Equipment Market by Product
Chapter 16. Company Profiles
16.1 Microsoft Corporation
16.1.1 Company Overview
16.1.2 Financial Analysis
16.1.3 Segmental and Regional Analysis
16.1.4 Research & Development Expenses
16.1.5 Recent Strategies and Developments
16.1.5.1 Partnerships, Collaborations, and Agreements
16.1.5.2 Product Launches and Product Expansions
16.1.6 SWOT Analysis
16.2 Amazon Web Services, Inc. (Amazon.com, Inc.)
16.2.1 Company Overview
16.2.2 Financial Analysis
16.2.3 Segmental and Regional Analysis
16.2.4 Recent Strategies and Developments
16.2.4.1 Partnerships, Collaborations, and Agreements
16.2.4.2 Product Launches and Product Expansions
16.2.5 SWOT Analysis
16.3 IBM Corporation
16.3.1 Company Overview
16.3.2 Financial Analysis
16.3.3 Regional & Segmental Analysis
16.3.4 Research & Development Expenses
16.3.5 Recent Strategies and Developments
16.3.5.1 Partnerships, Collaborations, and Agreements
16.3.5.2 Product Launches and Product Expansions
16.3.5.3 Acquisition and Mergers
16.3.6 SWOT Analysis
16.4 SAP SE
16.4.1 Company Overview
16.4.2 Financial Analysis
16.4.3 Regional Analysis
16.4.4 Research & Development Expense
16.4.5 Recent Strategies and Developments
16.4.5.1 Product Launches and Product Expansions
16.4.6 SWOT Analysis
16.5 Oracle Corporation
16.5.1 Company Overview
16.5.2 Financial Analysis
16.5.3 Segmental and Regional Analysis
16.5.4 Research & Development Expense
16.5.5 Recent Strategies and Developments
16.5.5.1 Partnerships, Collaborations, and Agreements
16.5.5.2 Product Launches and Product Expansions
16.5.6 SWOT Analysis
16.6 Informatica Inc.
16.6.1 Company Overview
16.6.2 Financial Analysis
16.6.3 Regional Analysis
16.6.4 Research & Development Expenses
16.6.5 Recent Strategies and Developments
16.6.5.1 Partnerships, Collaborations, and Agreements
16.6.5.2 Product Launches and Product Expansions
16.6.6 SWOT Analysis
16.7 Google LLC
16.7.1 Company Overview
16.7.2 Financial Analysis
16.7.3 Segmental and Regional Analysis
16.7.4 Research & Development Expenses
16.7.5 Recent Strategies and Developments
16.7.5.1 Product Launches and Product Expansions
16.7.6 SWOT Analysis
16.8 Snowflake, Inc.
16.8.1 Company Overview
16.8.2 Financial Analysis
16.8.3 Regional Analysis
16.8.4 Research & Development Expenses
16.8.5 Recent Strategies and Developments
16.8.5.1 Partnerships, Collaborations, and Agreements
16.8.5.2 Product Launches and Product Expansions
16.8.5.3 Acquisition and Mergers
16.8.6 SWOT Analysis
16.9 Siemens AG
16.9.1 Company Overview
16.9.2 Financial Analysis
16.9.3 Segmental and Regional Analysis
16.9.4 Research & Development Expense
16.9.5 Recent Strategies and Developments
16.9.5.1 Partnerships, Collaborations, and Agreements
16.9.6 SWOT Analysis
16.1 Honeywell International, Inc.
16.10.1 Company Overview
16.10.2 Financial Analysis
16.10.3 Segmental and Regional Analysis
16.10.4 Research & Development Expenses
16.10.5 Recent Strategies and Developments
16.10.5.1 Partnerships, Collaborations, and Agreements
16.10.5.2 Product Launches and Product Expansions
16.10.6 SWOT Analysis
Chapter 17. Winning Imperatives of Intrinsically Safe Equipment Market

Companies Mentioned

  • Banner Engineering Corporation
  • Honeywell International Inc.
  • Eaton Corporation plc
  • Emerson Electric Co.
  • Rockwell Automation, Inc.
  • Schneider Electric SE
  • Siemens AG
  • Fluke Corporation (Fortive Corporation)
  • Pepperl+Fuchs SE
  • R. STAHL AG