



The Global Smart Shelves Market is expected to reach USD 25.12 billion by 2033, growing at a CAGR of 23.5% during 2026-2033.
The Global Smart Shelves Market has evolved from early retail automation initiatives designed to improve inventory visibility and operational efficiency through sensor-based shelf monitoring systems. Initially, smart shelves primarily utilized weight sensors and basic electronic tracking technologies to detect stock levels and reduce manual inventory checks. Over time, these systems have advanced significantly through the integration of Internet of Things (IoT) connectivity, artificial intelligence (AI), cloud computing, RFID technology, computer vision, and advanced analytics platforms. Smart shelves have transformed from simple inventory management tools into intelligent retail infrastructure capable of supporting automated replenishment, dynamic pricing, personalized merchandising, and real-time customer engagement.
The market is witnessing robust growth driven by increasing retail digitalization, growing demand for real-time inventory visibility, rising labor cost pressures, and the expansion of automated store operations. Retailers are investing heavily in connected retail technologies to improve stock accuracy, reduce shrinkage, optimize shelf space utilization, and enhance shopper experiences. The growing adoption of AI-powered analytics, electronic shelf labeling (ESL), RFID-enabled inventory systems, and cloud-based retail management platforms continues to strengthen market demand globally.
The Smart Shelves Market is characterized by a moderately fragmented yet innovation-driven competitive landscape comprising electronic shelf label providers, RFID technology companies, IoT platform vendors, retail analytics specialists, and smart retail solution providers. Competition is primarily driven by technological innovation, sensor accuracy, AI capabilities, system interoperability, analytics sophistication, and deployment scalability. Market participants are actively investing in research and development to enhance inventory intelligence, dynamic pricing, computer vision analytics, and cloud-connected retail ecosystems. Strategic partnerships, ecosystem collaborations, product innovation, and geographic expansion remain key growth strategies adopted by leading companies.
The Smart Shelves Market demonstrates a moderately concentrated competitive structure where leading technology vendors collectively account for a significant share of market revenue. The market is led by companies specializing in electronic shelf labels, RFID technologies, retail IoT infrastructure, and AI-powered analytics platforms. Market growth is increasingly driven by the convergence of AI, RFID, computer vision, IoT connectivity, and cloud analytics. Retailers are prioritizing integrated solutions that deliver inventory visibility, dynamic pricing, automated replenishment, planogram compliance, and enhanced customer engagement. The growing adoption of connected retail ecosystems continues to strengthen competition among global and regional market participants.
Based on Component, the market is segmented into Hardware, Software, and Services.
The Hardware market dominated the Global Smart Shelves Market by Component in 2025, and is expected to continue to be a dominant market till 2033; thereby, achieving a market value of USD 13.12 billion by 2033, growing at a CAGR of 23.1 % during the forecast period. The Software market is expected to witness a CAGR of 24% during 2026-2033. The Services market is expected to witness a CAGR of 24% during 2026-2033.
Hardware accounted for the largest revenue share of 53.71% in 2025, supported by increasing deployment of RFID tags, sensors, cameras, communication modules, and electronic shelf labels that form the foundation of smart shelf infrastructure. Software represented 30.83% of the market, driven by growing demand for inventory analytics, AI-powered decision support systems, dynamic pricing platforms, and cloud-based retail management solutions. Services accounted for 15.46% of the market, supported by increasing demand for integration, deployment, consulting, maintenance, and managed services as retailers seek seamless implementation and optimization of smart shelf solutions.
Inventory Management held the largest market share of 37.94% in 2025 due to growing retailer focus on minimizing stockouts, improving inventory accuracy, and enhancing replenishment efficiency. Planogram Management accounted for 21.32%, supported by increasing emphasis on merchandising effectiveness and shelf optimization. Pricing Management represented 16.78%, driven by adoption of electronic shelf labels and dynamic pricing strategies. Content Management accounted for 12.93%, reflecting growing demand for personalized customer engagement and digital shelf communication. Other Applications represented 11.04% of market revenue.
Region-wise, the Smart Shelves Market is analyzed across North America, Europe, Asia Pacific, and LAMEA. The North America market dominated the Global Smart Shelves Market by Region in 2025, and is expected to continue to be a dominant market till 2033; thereby, achieving a market value of USD 8.21 billion by 2033, growing at a CAGR of 22.6 % during the forecast period. The Europe market is expected to witness a CAGR of 23.1% during 2026-2033.
North America accounted for the largest revenue share of 34.62% in 2025 due to strong retail digitalization initiatives, widespread adoption of IoT technologies, and significant investments in smart retail infrastructure. Europe represented 28.82% of market revenue, supported by extensive deployment of electronic shelf labels and retail automation technologies. Asia Pacific accounted for 27.86%, driven by rapid retail modernization, smart city initiatives, and increasing adoption of connected retail ecosystems. LAMEA contributed 8.71% of the market, supported by growing investments in retail transformation and inventory automation solutions.
Smart Shelves Market Coverage
The Global Smart Shelves Market has evolved from early retail automation initiatives designed to improve inventory visibility and operational efficiency through sensor-based shelf monitoring systems. Initially, smart shelves primarily utilized weight sensors and basic electronic tracking technologies to detect stock levels and reduce manual inventory checks. Over time, these systems have advanced significantly through the integration of Internet of Things (IoT) connectivity, artificial intelligence (AI), cloud computing, RFID technology, computer vision, and advanced analytics platforms. Smart shelves have transformed from simple inventory management tools into intelligent retail infrastructure capable of supporting automated replenishment, dynamic pricing, personalized merchandising, and real-time customer engagement.
Key Market Trends & Insights
- Hardware was the largest component segment in 2025, generating USD 2.55 billion, accounting for over 53% of total market revenue.
- Software and Services are expected to be the fastest-growing component segments, each expanding at a 24.0% CAGR through 2033.
- North America was the largest regional market in 2025, valued at USD 1.64 billion, ahead of Europe (USD 1.37 billion) and Asia Pacific (USD 1.32 billion).
- North America is expected to remain the largest regional market by 2033, reaching USD 8.21 billion.
- LAMEA is forecast to be the fastest-growing region, recording a 25.4% CAGR during 2026-2033.
- Inventory Management was the leading application segment in 2025, generating USD 1.80 billion, and is projected to reach USD 9.05 billion by 2033.
- Content Management is expected to be the fastest-growing major application segment, expanding at a 24.8% CAGR through 2033.
- Supermarkets represented the largest end-use segment in 2025 with USD 1.52 billion, maintaining leadership through the forecast period.
- Among major end-use sectors, Department Stores are projected to witness the fastest growth, registering a 24.5% CAGR from 2026 to 2033.
The market is witnessing robust growth driven by increasing retail digitalization, growing demand for real-time inventory visibility, rising labor cost pressures, and the expansion of automated store operations. Retailers are investing heavily in connected retail technologies to improve stock accuracy, reduce shrinkage, optimize shelf space utilization, and enhance shopper experiences. The growing adoption of AI-powered analytics, electronic shelf labeling (ESL), RFID-enabled inventory systems, and cloud-based retail management platforms continues to strengthen market demand globally.
The Smart Shelves Market is characterized by a moderately fragmented yet innovation-driven competitive landscape comprising electronic shelf label providers, RFID technology companies, IoT platform vendors, retail analytics specialists, and smart retail solution providers. Competition is primarily driven by technological innovation, sensor accuracy, AI capabilities, system interoperability, analytics sophistication, and deployment scalability. Market participants are actively investing in research and development to enhance inventory intelligence, dynamic pricing, computer vision analytics, and cloud-connected retail ecosystems. Strategic partnerships, ecosystem collaborations, product innovation, and geographic expansion remain key growth strategies adopted by leading companies.
Driving and Restraining Factors
Drivers- Integration of IoT and AI Technologies Enabling Real-Time Inventory Management
- Rising Demand for Enhanced Customer Engagement and Personalization
- Expansion of Automated Retail and Contactless Shopping Solutions
- Growing Adoption of RFID and Sensor Technologies for Inventory Accuracy and Loss Prevention
- High Initial Investment and Maintenance Costs
- Technological Integration Complexity and Infrastructure Challenges
- Data Privacy and Security Concerns
- AI-Driven Inventory Optimization and Predictive Analytics
- Expansion of Smart Shelves for Loss Prevention and Security Applications
- Adoption of Modular and Scalable Smart Shelf Architectures Supporting Omnichannel Retail
- High Implementation and Integration Costs Limiting Market Penetration
- Data Privacy and Cybersecurity Risks
- Technological Fragmentation and Lack of Interoperability Standards
Market Share Analysis
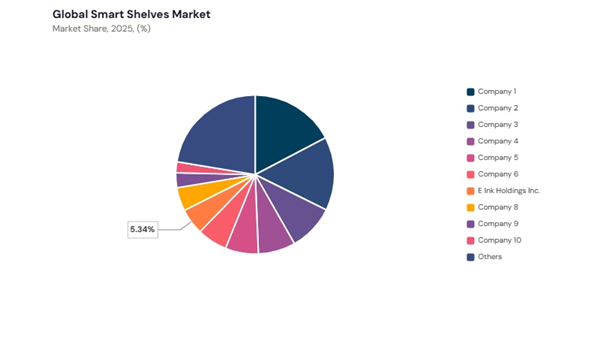
The Smart Shelves Market demonstrates a moderately concentrated competitive structure where leading technology vendors collectively account for a significant share of market revenue. The market is led by companies specializing in electronic shelf labels, RFID technologies, retail IoT infrastructure, and AI-powered analytics platforms. Market growth is increasingly driven by the convergence of AI, RFID, computer vision, IoT connectivity, and cloud analytics. Retailers are prioritizing integrated solutions that deliver inventory visibility, dynamic pricing, automated replenishment, planogram compliance, and enhanced customer engagement. The growing adoption of connected retail ecosystems continues to strengthen competition among global and regional market participants.
Component Outlook
Based on Component, the market is segmented into Hardware, Software, and Services.
The Hardware market dominated the Global Smart Shelves Market by Component in 2025, and is expected to continue to be a dominant market till 2033; thereby, achieving a market value of USD 13.12 billion by 2033, growing at a CAGR of 23.1 % during the forecast period. The Software market is expected to witness a CAGR of 24% during 2026-2033. The Services market is expected to witness a CAGR of 24% during 2026-2033.
Hardware accounted for the largest revenue share of 53.71% in 2025, supported by increasing deployment of RFID tags, sensors, cameras, communication modules, and electronic shelf labels that form the foundation of smart shelf infrastructure. Software represented 30.83% of the market, driven by growing demand for inventory analytics, AI-powered decision support systems, dynamic pricing platforms, and cloud-based retail management solutions. Services accounted for 15.46% of the market, supported by increasing demand for integration, deployment, consulting, maintenance, and managed services as retailers seek seamless implementation and optimization of smart shelf solutions.
Application Outlook
Based on Application, the market is segmented into Inventory Management, Planogram Management, Pricing Management, Content Management, and Other Applications. The Inventory Management market dominated the Global Smart Shelves Market by Application in 2025, and is expected to continue to be a dominant market till 2033; thereby, achieving a market value of USD 9.04 billion by 2033, growing at a CAGR of 22.7 % during the forecast period. The Planogram Management market is expected to witness a CAGR of 23.2% during 2026-2033.Inventory Management held the largest market share of 37.94% in 2025 due to growing retailer focus on minimizing stockouts, improving inventory accuracy, and enhancing replenishment efficiency. Planogram Management accounted for 21.32%, supported by increasing emphasis on merchandising effectiveness and shelf optimization. Pricing Management represented 16.78%, driven by adoption of electronic shelf labels and dynamic pricing strategies. Content Management accounted for 12.93%, reflecting growing demand for personalized customer engagement and digital shelf communication. Other Applications represented 11.04% of market revenue.
End-Use Outlook
Based on End Use, the market is segmented into Supermarkets, Hypermarkets, Warehouses, Department Stores, and Other End Use. Supermarkets accounted for the largest market share of 32.16% in 2025 due to high-volume inventory management requirements and increasing adoption of real-time shelf monitoring systems. Hypermarkets followed with 30.39%, benefiting from large-scale inventory visibility and automated replenishment capabilities. Warehouses represented 16.94%, supported by growing demand for inventory accuracy and logistics optimization. Department Stores accounted for 14.64%, leveraging smart shelves for merchandising effectiveness and customer engagement. Other End Use segments contributed 5.88% of market revenue.Region-wise, the Smart Shelves Market is analyzed across North America, Europe, Asia Pacific, and LAMEA. The North America market dominated the Global Smart Shelves Market by Region in 2025, and is expected to continue to be a dominant market till 2033; thereby, achieving a market value of USD 8.21 billion by 2033, growing at a CAGR of 22.6 % during the forecast period. The Europe market is expected to witness a CAGR of 23.1% during 2026-2033.
North America accounted for the largest revenue share of 34.62% in 2025 due to strong retail digitalization initiatives, widespread adoption of IoT technologies, and significant investments in smart retail infrastructure. Europe represented 28.82% of market revenue, supported by extensive deployment of electronic shelf labels and retail automation technologies. Asia Pacific accounted for 27.86%, driven by rapid retail modernization, smart city initiatives, and increasing adoption of connected retail ecosystems. LAMEA contributed 8.71% of the market, supported by growing investments in retail transformation and inventory automation solutions.
Smart Shelves Market Coverage
Recent Strategies Deployed in the Market
- VusionGroup expanded AI-powered smart shelf and connected retail solutions to improve inventory visibility, pricing automation, and customer engagement.
- Walmart expanded intelligent inventory monitoring technologies and smart retail infrastructure to strengthen replenishment efficiency and omnichannel operations.
- Amazon strengthened its smart retail ecosystem through sensor-driven store technologies supporting cashier-less shopping and intelligent inventory management.
- Retailers increasingly collaborated with IoT platform providers and analytics companies to create connected store ecosystems and predictive inventory management solutions.
- RFID and computer vision technology providers expanded integration partnerships to improve inventory visibility, theft prevention, and consumer behavior analytics.
- Smart shelf deployments expanded across Asia-Pacific and European markets as retailers accelerated store automation and digital merchandising initiatives.
- Market participants increased investments in AI-powered retail analytics, edge computing, and cloud-based inventory intelligence platforms.
- Vendors strengthened cybersecurity capabilities and interoperability features to support growing connected retail infrastructure requirements.
List of Key Companies Profiled
- VusionGroup
- Avery Dennison Corporation
- Trax Technology Solutions Pte Ltd.
- Honeywell International Inc.
- Huawei Technologies Co., Ltd.
- Samsung Electronics Co., Ltd.
- E Ink Holdings Inc.
- Intel Corporation
- Lenovo PCCW Solutions Limited
- Happiest Minds Technologies Pvt. Ltd.
Market Report Segmentation
By Component- Hardware
- Software
- Services
- Inventory Management
- Planogram Management
- Pricing Management
- Content Management
- Other Applications
- Supermarkets
- Hypermarkets
- Warehouses
- Department Stores
- Other End Use
- North America
- US
- Canada
- Mexico
- Rest of North America
- Europe
- Germany
- UK
- France
- Russia
- Spain
- Italy
- Rest of Europe
- Asia Pacific
- China
- Japan
- India
- South Korea
- Singapore
- Malaysia
- Rest of Asia Pacific
- LAMEA
- Brazil
- Argentina
- UAE
- Saudi Arabia
- South Africa
- Nigeria
- Rest of LAMEA
Table of Contents
Chapter 1. Research Scope & Methodology
Chapter 2. Market Overview
Chapter 3. Key Factors Impacting Market
Chapter 6. Competition Analysis - Global
Chapter 7. Segmentation By Component
Chapter 8. Segmentation By Application
Chapter 9. Segmentation By End Use
Chapter 10. North America Market
Chapter 11. Europe Market
Chapter 12. Asia Pacific Market
Chapter 13. LAMEA Market
Chapter 14. Company Snapshot
Companies Mentioned
• VusionGroup• Avery Dennison Corporation
• Trax Technology Solutions Pte Ltd.
• Honeywell International Inc.
• Huawei Technologies Co., Ltd.
• Samsung Electronics Co., Ltd.
• E Ink Holdings Inc.
• Intel Corporation
• Lenovo PCCW Solutions Limited
• Happiest Minds Technologies Pvt. Ltd.


