



The Asia Pacific 3D Animation Market is expected to witness market growth of 12.7% CAGR during the forecast period (2026-2033) and is projected to reach USD 15.8 Billion by 2031.
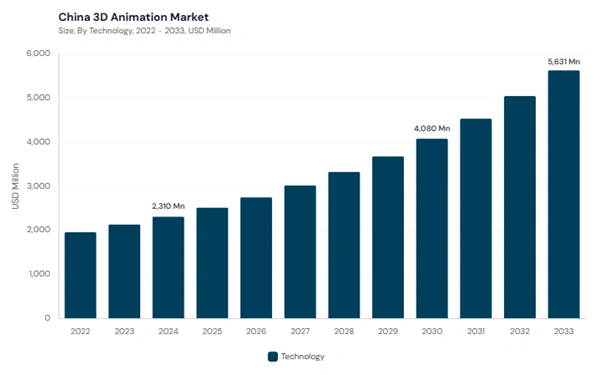
The China market dominated the Asia Pacific 3D Animation Market by country in 2025, and is expected to continue to be a dominant market till 2033; thereby, achieving a market value of USD 5.6 Billion by 2033. The Japan market is expected to witness a CAGR of 11.9% during 2026-2033. Additionally, the India market is expected to witness a CAGR of 14.8% during 2026-2033. China and Japan led the Asia Pacific 3D Animation Market by Country with a market share of 41.3% and 18.6% in 2025.
The Asia Pacific 3D animation market has evolved rapidly over the past decade, driven by expanding digital infrastructure, rising content consumption, and increasing adoption of animation technologies across industries. Initially, the market was supported by outsourcing services and cost-effective animation production, particularly in countries like India and Southeast Asia. Over time, the region transitioned toward developing its own creative ecosystems, supported by local studios, gaming companies, and digital media platforms. The growth of domestic film industries, online streaming platforms, and mobile gaming has significantly contributed to the expansion of 3D animation capabilities. Today, the region reflects a hybrid ecosystem where both outsourced production and original content creation coexist, supported by a growing base of skilled professionals and improving technological infrastructure.
The market is currently shaped by strong trends in AI adoption, cloud-based production, and the rapid expansion of gaming and mobile-first content platforms. AI tools are increasingly used to automate animation workflows, improve rendering efficiency, and reduce production timelines, making advanced animation more accessible across the region. Cloud-based collaboration platforms are enabling distributed teams to work across geographies, which is particularly important in Asia Pacific where talent is widely dispersed. Additionally, the rise of AR, VR, and metaverse-driven applications is pushing demand for real-time 3D animation content. The growing popularity of mobile gaming, anime-style content, and digital entertainment is also influencing animation styles and production techniques. These trends collectively support the region’s transition from a cost-driven production hub to a technology-enabled creative market.
Based on Technology, the market is segmented into 3D Modeling, 3D Rendering, Visual Effects (VFX), and Motion Graphics. The 3D Modeling segment dominated the Asia Pacific 3D Animation Market by Technology in 2025 and is expected to continue to be a dominant segment till 2033; thereby, achieving a market value of USD 5.1 Billion by 2032. The Visual Effects (VFX) segment is expected to witness the highest CAGR of 13.3% during 2026-2033. This reflects the region’s increasing involvement in film production, gaming, and high-quality digital content creation.
AI integration, cloud-based workflows, and real-time rendering technologies are being actively adopted to enhance production efficiency and scalability. The presence of both domestic technology providers and international collaborations further strengthens the competitive landscape. As a result, China continues to play a central role in shaping the Asia Pacific 3D animation market’s growth trajectory.
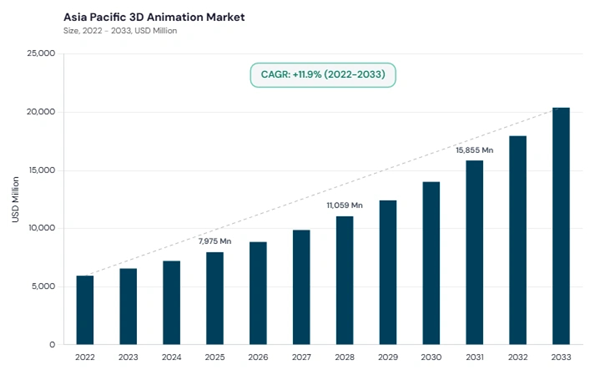
The China market dominated the Asia Pacific 3D Animation Market by country in 2025, and is expected to continue to be a dominant market till 2033; thereby, achieving a market value of USD 5.6 Billion by 2033. The Japan market is expected to witness a CAGR of 11.9% during 2026-2033. Additionally, the India market is expected to witness a CAGR of 14.8% during 2026-2033. China and Japan led the Asia Pacific 3D Animation Market by Country with a market share of 41.3% and 18.6% in 2025.
The Asia Pacific 3D animation market has evolved rapidly over the past decade, driven by expanding digital infrastructure, rising content consumption, and increasing adoption of animation technologies across industries. Initially, the market was supported by outsourcing services and cost-effective animation production, particularly in countries like India and Southeast Asia. Over time, the region transitioned toward developing its own creative ecosystems, supported by local studios, gaming companies, and digital media platforms. The growth of domestic film industries, online streaming platforms, and mobile gaming has significantly contributed to the expansion of 3D animation capabilities. Today, the region reflects a hybrid ecosystem where both outsourced production and original content creation coexist, supported by a growing base of skilled professionals and improving technological infrastructure.
The market is currently shaped by strong trends in AI adoption, cloud-based production, and the rapid expansion of gaming and mobile-first content platforms. AI tools are increasingly used to automate animation workflows, improve rendering efficiency, and reduce production timelines, making advanced animation more accessible across the region. Cloud-based collaboration platforms are enabling distributed teams to work across geographies, which is particularly important in Asia Pacific where talent is widely dispersed. Additionally, the rise of AR, VR, and metaverse-driven applications is pushing demand for real-time 3D animation content. The growing popularity of mobile gaming, anime-style content, and digital entertainment is also influencing animation styles and production techniques. These trends collectively support the region’s transition from a cost-driven production hub to a technology-enabled creative market.
Component Outlook
Based on Component, the market is segmented into Solution, and Service. The Solution segment dominated the Asia Pacific 3D Animation Market by Component in 2025 and is expected to continue to be a dominant segment till 2033; thereby, achieving a market value of USD 9.1 Billion by 2032. The Service segment is expected to witness a CAGR of 13.1% during 2026-2033. Growth in services is supported by increasing outsourcing demand, training needs, and expansion of animation production across emerging economies.Deployment Mode Outlook
Based on Deployment Mode, the market is segmented into On-Premise, and Cloud. The On-Premise segment dominated the Asia Pacific 3D Animation Market by Deployment Mode in 2025 and is expected to continue to be a dominant segment till 2033; thereby, achieving a market value of USD10.42 billion by 2032. The Cloud segment is expected to witness the highest CAGR of 13.3% during 2026-2033. Cloud adoption is accelerating due to cost advantages, remote collaboration needs, and increasing adoption among SMEs and independent creators.Technology Outlook
Based on Technology, the market is segmented into 3D Modeling, 3D Rendering, Visual Effects (VFX), and Motion Graphics. The 3D Modeling segment dominated the Asia Pacific 3D Animation Market by Technology in 2025 and is expected to continue to be a dominant segment till 2033; thereby, achieving a market value of USD 5.1 Billion by 2032. The Visual Effects (VFX) segment is expected to witness the highest CAGR of 13.3% during 2026-2033. This reflects the region’s increasing involvement in film production, gaming, and high-quality digital content creation.
End-User Outlook
Based on End-User, the market is segmented into Media & Entertainment, Manufacturing & Construction, Government & Defense, Education, Healthcare, and Other End-User. The Media & Entertainment segment dominated the Asia Pacific 3D Animation Market by End-User in 2025 and is expected to continue to be a dominant segment till 2033; thereby, achieving a market value of USD 6.3 Billion by 2032. The Education segment is expected to witness a CAGR of 13.8% during 2026-2033. The increasing use of 3D animation in e-learning, simulation-based training, and digital education platforms is supporting segment growth across developing economies.Country Outlook
The China 3D animation market is the largest in Asia Pacific, supported by strong government backing, rapid digital transformation, and a booming entertainment and gaming industry. The country has invested heavily in animation studios, technology infrastructure, and digital content platforms, enabling the development of large-scale animation projects and original IP creation. China’s gaming industry, one of the largest globally, is a major driver of demand for real-time 3D animation and immersive content. Additionally, the expansion of OTT platforms and online streaming services has increased the need for high-quality animated content across films, series, and short-form media.AI integration, cloud-based workflows, and real-time rendering technologies are being actively adopted to enhance production efficiency and scalability. The presence of both domestic technology providers and international collaborations further strengthens the competitive landscape. As a result, China continues to play a central role in shaping the Asia Pacific 3D animation market’s growth trajectory.
List of Key Companies Profiled
- Autodesk, Inc.
- Adobe, Inc.
- NVIDIA Corporation
- Maxon Computer GmbH
- Side Effects Software
- Corel
- Vizrt
- DeepMotion, Inc.
- Zco Corporation
- Corus Entertainment
Market Report Segmentation
By Component- Solution
- Service
- On-Premise
- Cloud
- 3D Modeling
- 3D Rendering
- Visual Effects (VFX)
- Motion Graphics
- Media & Entertainment
- Manufacturing & Construction
- Government & Defense
- Education
- Healthcare
- Other End-User
- China
- Japan
- India
- South Korea
- Singapore
- Malaysia
- Rest of Asia Pacific
Table of Contents
Chapter 1. Asia Pacific Market1.1 Market Overview
1.2 Key Factors Impacting Market
1.2.1 Market Drivers
1.2.2 Market Restraints
1.2.3 Market Opportunities
1.2.4 Market Challenges
1.2.5 Market Trends
1.2.6 State of Competition
1.2.7 Market Consolidation
1.2.8 Key Customer Criteria
1.3 Product Life Cycle
1.4 Segmentation By Component
1.4.1 Solution
1.4.2 Services
1.5 Segmentation By Deployment Mode
1.5.1 On-Premise
1.5.2 Cloud
1.6 Segmentation By Technology
1.6.1 3D Modeling
1.6.2 3D Rendering
1.6.3 Visual Effects (VFX)
1.6.4 Motion Graphics
1.7 Segmentation By End-User
1.7.1 Media & Entertainment
1.7.2 Manufacturing & Construction
1.7.3 Government & Defense
1.7.4 Education
1.7.5 Healthcare
1.7.6 Other End-User
1.8 Segmentation By Country
1.8.1 China
1.8.1.1 Segmentation By Component
1.8.1.1.1 Solution
1.8.1.1.2 Services
1.8.1.2 Segmentation By Deployment Mode
1.8.1.2.1 On-Premise
1.8.1.2.2 Cloud
1.8.1.3 Segmentation By Technology
1.8.1.3.1 3D Modeling
1.8.1.3.2 3D Rendering
1.8.1.3.3 Visual Effects (VFX)
1.8.1.3.4 Motion Graphics
1.8.1.4 Segmentation By End-User
1.8.1.4.1 Media & Entertainment
1.8.1.4.2 Manufacturing & Construction
1.8.1.4.3 Government & Defense
1.8.1.4.4 Education
1.8.1.4.5 Healthcare
1.8.1.4.6 Other End-User
1.8.2 Japan
1.8.2.1 Segmentation By Component
1.8.2.1.1 Solution
1.8.2.1.2 Services
1.8.2.2 Segmentation By Deployment Mode
1.8.2.2.1 On-Premise
1.8.2.2.2 Cloud
1.8.2.3 Segmentation By Technology
1.8.2.3.1 3D Modeling
1.8.2.3.2 3D Rendering
1.8.2.3.3 Visual Effects (VFX)
1.8.2.3.4 Motion Graphics
1.8.2.4 Segmentation By End-User
1.8.2.4.1 Media & Entertainment
1.8.2.4.2 Manufacturing & Construction
1.8.2.4.3 Government & Defense
1.8.2.4.4 Education
1.8.2.4.5 Healthcare
1.8.2.4.6 Other End-User
1.8.3 India
1.8.3.1 Segmentation By Component
1.8.3.1.1 Solution
1.8.3.1.2 Services
1.8.3.2 Segmentation By Deployment Mode
1.8.3.2.1 On-Premise
1.8.3.2.2 Cloud
1.8.3.3 Segmentation By Technology
1.8.3.3.1 3D Modeling
1.8.3.3.2 3D Rendering
1.8.3.3.3 Visual Effects (VFX)
1.8.3.3.4 Motion Graphics
1.8.3.4 Segmentation By End-User
1.8.3.4.1 Media & Entertainment
1.8.3.4.2 Manufacturing & Construction
1.8.3.4.3 Government & Defense
1.8.3.4.4 Education
1.8.3.4.5 Healthcare
1.8.3.4.6 Other End-User
1.8.4 South Korea
1.8.4.1 Segmentation By Component
1.8.4.1.1 Solution
1.8.4.1.2 Services
1.8.4.2 Segmentation By Deployment Mode
1.8.4.2.1 On-Premise
1.8.4.2.2 Cloud
1.8.4.3 Segmentation By Technology
1.8.4.3.1 3D Modeling
1.8.4.3.2 3D Rendering
1.8.4.3.3 Visual Effects (VFX)
1.8.4.3.4 Motion Graphics
1.8.4.4 Segmentation By End-User
1.8.4.4.1 Media & Entertainment
1.8.4.4.2 Manufacturing & Construction
1.8.4.4.3 Government & Defense
1.8.4.4.4 Education
1.8.4.4.5 Healthcare
1.8.4.4.6 Other End-User
1.8.5 Singapore
1.8.5.1 Segmentation By Component
1.8.5.1.1 Solution
1.8.5.1.2 Services
1.8.5.2 Segmentation By Deployment Mode
1.8.5.2.1 On-Premise
1.8.5.2.2 Cloud
1.8.5.3 Segmentation By Technology
1.8.5.3.1 3D Modeling
1.8.5.3.2 3D Rendering
1.8.5.3.3 Visual Effects (VFX)
1.8.5.3.4 Motion Graphics
1.8.5.4 Segmentation By End-User
1.8.5.4.1 Media & Entertainment
1.8.5.4.2 Manufacturing & Construction
1.8.5.4.3 Government & Defense
1.8.5.4.4 Education
1.8.5.4.5 Healthcare
1.8.5.4.6 Other End-User
1.8.6 Malaysia
1.8.6.1 Segmentation By Component
1.8.6.1.1 Solution
1.8.6.1.2 Services
1.8.6.2 Segmentation By Deployment Mode
1.8.6.2.1 On-Premise
1.8.6.2.2 Cloud
1.8.6.3 Segmentation By Technology
1.8.6.3.1 3D Modeling
1.8.6.3.2 3D Rendering
1.8.6.3.3 Visual Effects (VFX)
1.8.6.3.4 Motion Graphics
1.8.6.4 Segmentation By End-User
1.8.6.4.1 Media & Entertainment
1.8.6.4.2 Manufacturing & Construction
1.8.6.4.3 Government & Defense
1.8.6.4.4 Education
1.8.6.4.5 Healthcare
1.8.6.4.6 Other End-User
1.8.7 Rest of Asia Pacific
1.8.7.1 Segmentation By Component
1.8.7.1.1 Solution
1.8.7.1.2 Services
1.8.7.2 Segmentation By Deployment Mode
1.8.7.2.1 On-Premise
1.8.7.2.2 Cloud
1.8.7.3 Segmentation By Technology
1.8.7.3.1 3D Modeling
1.8.7.3.2 3D Rendering
1.8.7.3.3 Visual Effects (VFX)
1.8.7.3.4 Motion Graphics
1.8.7.4 Segmentation By End-User
1.8.7.4.1 Media & Entertainment
1.8.7.4.2 Manufacturing & Construction
1.8.7.4.3 Government & Defense
1.8.7.4.4 Education
1.8.7.4.5 Healthcare
1.8.7.4.6 Other End-User
Chapter 2. Company Profiles
2.1 Adobe, Inc.
2.1.1 Company Overview
2.1.2 Financial Analysis
2.1.3 Segmental and Regional Analysis
2.1.2 Research & Development Expense
2.1.5 Recent Strategies and Developments
2.1.5.1 Product Launches and Product Expansions
2.1.6 SWOT Analysis
2.2 Autodesk, Inc.
2.2.1 Company Overview
2.2.2 Financial Analysis
2.2.3 Regional Analysis
2.2.2 Research & Development Expenses
2.2.5 Recent Strategies and Developments
2.2.5.1 Product Launches and Product Expansions
2.2.6 SWOT Analysis
2.3 Corel Corporation (KKR & Co., Inc.)
2.3.1 Company Overview
2.3.2 Financial Analysis
2.3.3 Regional & Segmental Analysis
2.2 NVIDIA Corporation
2.2.1 Company Overview
2.2.2 Financial Analysis
2.2.3 Segmental and Regional Analysis
2.2.2 Research & Development Expenses
2.2.5 Recent Strategies and Developments
2.2.5.1 Product Launches and Product Expansions
2.2.6 SWOT Analysis
2.5 DeepMotion, Inc.
2.5.1 Company Overview
2.5.2 Recent Strategies and Developments
2.5.2.1 Product Launches and Product Expansions
2.6 Maxon Computer GmbH
2.6.1 Company Overview
2.6.2 Recent Strategies and Developments
2.6.2.1 Acquisition and Mergers
2.7 Side Effects Software Inc.
2.7.1 Company Overview
2.8 Corus Entertainment Inc.
2.8.1 Company Overview
2.8.2 Financial Analysis
2.8.3 Segmental and Regional Analysis
2.9 Vizrt Group AS
2.9.1 Company Overview
2.1 Zco Corporation
2.10.1 Company Overview
Companies Mentioned
- Autodesk, Inc.
- Adobe, Inc.
- NVIDIA Corporation
- Maxon Computer GmbH
- Side Effects Software
- Corel
- Vizrt
- DeepMotion, Inc.
- Zco Corporation
- Corus Entertainment


