



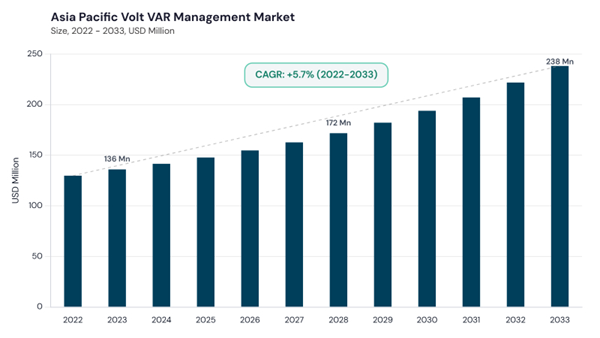
The Asia Pacific Volt VAR Management Market is projected to reach $193.97 million by 2030, growing at a CAGR of 6.4% during the forecast period (2026-2033).
The China market dominated the Asia Pacific Volt VAR Management Market by country in 2025, and is expected to continue to be a dominant market till 2033; thereby, achieving a market value of $66.55 million by 2033. The Japan market is expected to witness a CAGR of 5.5% during 2026-2033. Additionally, the India market is expected to witness a CAGR of 7.2% during 2026-2033. The China and Japan led the Asia Pacific Volt VAR Management Market by Country with a market share of 31.9% and 16.2% in 2025. The Singapore market is expected to witness a CAGR of 8.5% throughout the forecast period.
The Asia Pacific Volt VAR Management Market is experiencing significant growth due to rapid urbanization, increasing electricity consumption, expansion of renewable energy infrastructure, and rising investments in smart grid modernization across major economies including China, Japan, India, South Korea, Singapore, and Malaysia. Utilities across the region are increasingly deploying Volt VAR optimization solutions to improve voltage stability, reduce line losses, enhance energy efficiency, and strengthen power quality management across transmission and distribution networks. The growing penetration of distributed energy resources, solar and wind power installations, and electric vehicle charging infrastructure is further increasing the demand for intelligent voltage regulation and reactive power management technologies across Asia Pacific.
Governments and utility providers throughout the region are focusing on grid digitization, renewable energy integration, and modernization of aging power infrastructure, which is accelerating adoption of advanced Volt VAR optimization systems. Utilities are increasingly integrating AI-driven analytics, IoT-enabled monitoring systems, cloud-based energy management platforms, and advanced distribution management systems (ADMS) to optimize grid operations and improve overall network reliability. Additionally, utilities are leveraging Volt VAR management solutions to support conservation voltage reduction (CVR), reduce operational expenditures, improve load balancing, and defer costly infrastructure upgrades.
Furthermore, rising investments in smart city initiatives, industrial electrification, and utility automation projects across emerging economies are expected to create strong opportunities for market expansion throughout the forecast period. Increasing regulatory support for energy efficiency and grid reliability is also expected to further strengthen the adoption of Volt VAR management technologies across the Asia Pacific region.
The Japan Volt VAR Management Market attained a market size of $23.89 million in 2025 and is expected to reach $36.24 million by 2033, growing at a CAGR of 5.5% during the forecast period. Increasing investments in smart transmission systems, digital substations, and grid modernization projects are driving demand for intelligent voltage optimization technologies across Japan. Rising emphasis on energy efficiency, grid resiliency, and renewable integration is further supporting adoption of advanced Volt VAR management solutions.
The India Volt VAR Management Market attained a market size of $20.03 million in 2025 and is expected to reach $34.28 million by 2033, growing at a CAGR of 7.2% during the forecast period. Rapid urbanization, increasing electricity demand, and government-led smart grid initiatives are accelerating deployment of Volt VAR optimization technologies across India. Utilities are increasingly focusing on reducing technical losses, improving power quality, and modernizing distribution infrastructure to support expanding industrial and commercial power consumption.
The China market dominated the Asia Pacific Volt VAR Management Market by country in 2025, and is expected to continue to be a dominant market till 2033; thereby, achieving a market value of $66.55 million by 2033. The Japan market is expected to witness a CAGR of 5.5% during 2026-2033. Additionally, the India market is expected to witness a CAGR of 7.2% during 2026-2033. The China and Japan led the Asia Pacific Volt VAR Management Market by Country with a market share of 31.9% and 16.2% in 2025. The Singapore market is expected to witness a CAGR of 8.5% throughout the forecast period.
The Asia Pacific Volt VAR Management Market is experiencing significant growth due to rapid urbanization, increasing electricity consumption, expansion of renewable energy infrastructure, and rising investments in smart grid modernization across major economies including China, Japan, India, South Korea, Singapore, and Malaysia. Utilities across the region are increasingly deploying Volt VAR optimization solutions to improve voltage stability, reduce line losses, enhance energy efficiency, and strengthen power quality management across transmission and distribution networks. The growing penetration of distributed energy resources, solar and wind power installations, and electric vehicle charging infrastructure is further increasing the demand for intelligent voltage regulation and reactive power management technologies across Asia Pacific.
Governments and utility providers throughout the region are focusing on grid digitization, renewable energy integration, and modernization of aging power infrastructure, which is accelerating adoption of advanced Volt VAR optimization systems. Utilities are increasingly integrating AI-driven analytics, IoT-enabled monitoring systems, cloud-based energy management platforms, and advanced distribution management systems (ADMS) to optimize grid operations and improve overall network reliability. Additionally, utilities are leveraging Volt VAR management solutions to support conservation voltage reduction (CVR), reduce operational expenditures, improve load balancing, and defer costly infrastructure upgrades.
Furthermore, rising investments in smart city initiatives, industrial electrification, and utility automation projects across emerging economies are expected to create strong opportunities for market expansion throughout the forecast period. Increasing regulatory support for energy efficiency and grid reliability is also expected to further strengthen the adoption of Volt VAR management technologies across the Asia Pacific region.
Network Level Outlook
Based on Network Level, the market is segmented into Distribution Network and Transmission Network. The Distribution Network segment dominated the Asia Pacific Volt VAR Management Market by Network Level in 2025, and is expected to continue to be a dominant segment till 2033; thereby, achieving a market value of $160.29 million by 2033, growing at a CAGR of 6.0% during the forecast period. The Transmission Network segment is expected to witness a CAGR of 7.1% during 2026-2033.Component Outlook
Based on Component, the market is segmented into Hardware, Software, and Services. The Hardware segment dominated the Asia Pacific Volt VAR Management Market by Component in 2025, and is expected to continue to be a dominant segment till 2033; thereby, achieving a market value of $133.99 million by 2033, growing at a CAGR of 5.9% during the forecast period. The Software segment is expected to witness a CAGR of 6.8% during 2026-2033. Additionally, the Services segment is expected to witness the highest CAGR of 7.2% during the forecast period.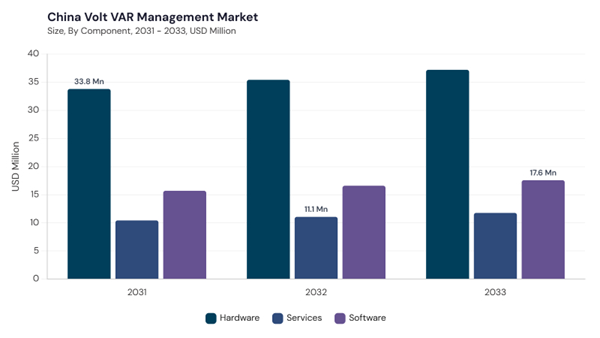
Utility Type Outlook
Based on Utility Type, the market is segmented into Investor-Owned Utilities (IOUs), Municipal Utilities, Electric Cooperatives, and Industrial / Private Utilities. The Investor-Owned Utilities (IOUs) segment dominated the Asia Pacific Volt VAR Management Market by Utility Type in 2025, and is expected to continue to be a dominant segment till 2033; thereby, achieving a market value of $124.54 million by 2033, growing at a CAGR of 5.9% during the forecast period. The Municipal Utilities segment is expected to witness a CAGR of 6.7% during 2026-2033. Additionally, the Electric Cooperatives segment is expected to witness the highest CAGR of 7.1% during the forecast period.Country Outlook
The China Volt VAR Management Market attained a market size of $47.09 million in 2025 and is expected to reach $66.55 million by 2033, growing at a CAGR of 4.6% during the forecast period. China dominates the regional market owing to large-scale smart grid investments, rising renewable energy deployment, and rapid expansion of utility automation infrastructure. Utilities across the country are increasingly implementing advanced Volt VAR optimization systems to improve voltage regulation, reduce transmission losses, and support integration of renewable energy resources into the national grid.The Japan Volt VAR Management Market attained a market size of $23.89 million in 2025 and is expected to reach $36.24 million by 2033, growing at a CAGR of 5.5% during the forecast period. Increasing investments in smart transmission systems, digital substations, and grid modernization projects are driving demand for intelligent voltage optimization technologies across Japan. Rising emphasis on energy efficiency, grid resiliency, and renewable integration is further supporting adoption of advanced Volt VAR management solutions.
The India Volt VAR Management Market attained a market size of $20.03 million in 2025 and is expected to reach $34.28 million by 2033, growing at a CAGR of 7.2% during the forecast period. Rapid urbanization, increasing electricity demand, and government-led smart grid initiatives are accelerating deployment of Volt VAR optimization technologies across India. Utilities are increasingly focusing on reducing technical losses, improving power quality, and modernizing distribution infrastructure to support expanding industrial and commercial power consumption.
List of Key Companies Profiled
- Schneider Electric SE
- Siemens AG
- ABB Ltd.
- Eaton Corporation plc
- General Electric Company
- Mitsubishi Electric Corporation
- Landis+Gyr Group AG
- Open Systems International, Inc.
- S&C Electric Company
- Doble Engineering Company
Market Report Segmentation
By Network Level- Distribution Network
- Transmission Network
- Hardware
- Software
- Services
- Investor-Owned Utilities (IOUs)
- Municipal Utilities
- Electric Cooperatives
- Industrial / Private Utilities
- China
- Japan
- India
- South Korea
- Singapore
- Malaysia
- Rest of Asia Pacific
Table of Contents
Chapter 1. Asia Pacific Market1.1 Market Overview
1.2 Key Factors Impacting Market
1.2.1 Market Drivers
1.2.2 Market Restraints
1.2.3 Market Opportunities
1.2.4 Market Challenges
1.2.5 Market Trends
1.2.6 State of Competition
1.2.7 Market Consolidation
1.2.8 Key Customer Criteria
1.3 Product Life Cycle
1.4 Segmentation By Component
1.4.1 Hardware
1.4.2 Software
1.4.3 Services
1.5 Segmentation By Network Level
1.5.1 Distribution Network
1.5.2 Transmission Network
1.6 Segmentation By Utility Type
1.6.1 Investor-Owned Utilities (IOUs)
1.6.2 Municipal Utilities
1.6.3 Electric Cooperatives
1.6.4 Industrial / Private Utilities
1.7 Segmentation By Country
1.7.1 China
1.7.1.1 Segmentation By Component
1.7.1.1.1 Hardware
1.7.1.1.2 Software
1.7.1.1.3 Services
1.7.1.2 Segmentation By Network Level
1.7.1.2.1 Distribution Network
1.7.1.2.2 Transmission Network
1.7.1.3 Segmentation By Utility Type
1.7.1.3.1 Investor-Owned Utilities (IOUs)
1.7.1.3.2 Municipal Utilities
1.7.1.3.3 Electric Cooperatives
1.7.1.3.4 Industrial / Private Utilities
1.7.2 Japan
1.7.2.1 Segmentation By Component
1.7.2.1.1 Hardware
1.7.2.1.2 Software
1.7.2.1.3 Services
1.7.2.2 Segmentation By Network Level
1.7.2.2.1 Distribution Network
1.7.2.2.2 Transmission Network
1.7.2.3 Segmentation By Utility Type
1.7.2.3.1 Investor-Owned Utilities (IOUs)
1.7.2.3.2 Municipal Utilities
1.7.2.3.3 Electric Cooperatives
1.7.2.3.4 Industrial / Private Utilities
1.7.3 India
1.7.3.1 Segmentation By Component
1.7.3.1.1 Hardware
1.7.3.1.2 Software
1.7.3.1.3 Services
1.7.3.2 Segmentation By Network Level
1.7.3.2.1 Distribution Network
1.7.3.2.2 Transmission Network
1.7.3.3 Segmentation By Utility Type
1.7.3.3.1 Investor-Owned Utilities (IOUs)
1.7.3.3.2 Municipal Utilities
1.7.3.3.3 Electric Cooperatives
1.7.3.3.4 Industrial / Private Utilities
1.7.4 South Korea
1.7.4.1 Segmentation By Component
1.7.4.1.1 Hardware
1.7.4.1.2 Software
1.7.4.1.3 Services
1.7.4.2 Segmentation By Network Level
1.7.4.2.1 Distribution Network
1.7.4.2.2 Transmission Network
1.7.4.3 Segmentation By Utility Type
1.7.4.3.1 Investor-Owned Utilities (IOUs)
1.7.4.3.2 Municipal Utilities
1.7.4.3.3 Electric Cooperatives
1.7.4.3.4 Industrial / Private Utilities
1.7.5 Singapore
1.7.5.1 Segmentation By Component
1.7.5.1.1 Hardware
1.7.5.1.2 Software
1.7.5.1.3 Services
1.7.5.2 Segmentation By Network Level
1.7.5.2.1 Distribution Network
1.7.5.2.2 Transmission Network
1.7.5.3 Segmentation By Utility Type
1.7.5.3.1 Investor-Owned Utilities (IOUs)
1.7.5.3.2 Municipal Utilities
1.7.5.3.3 Electric Cooperatives
1.7.5.3.4 Industrial / Private Utilities
1.7.6 Malaysia
1.7.6.1 Segmentation By Component
1.7.6.1.1 Hardware
1.7.6.1.2 Software
1.7.6.1.3 Services
1.7.6.2 Segmentation By Network Level
1.7.6.2.1 Distribution Network
1.7.6.2.2 Transmission Network
1.7.6.3 Segmentation By Utility Type
1.7.6.3.1 Investor-Owned Utilities (IOUs)
1.7.6.3.2 Municipal Utilities
1.7.6.3.3 Electric Cooperatives
1.7.6.3.4 Industrial / Private Utilities
1.7.7 Rest of Asia Pacific
1.7.7.1 Segmentation By Component
1.7.7.1.1 Hardware
1.7.7.1.2 Software
1.7.7.1.3 Services
1.7.7.2 Segmentation By Network Level
1.7.7.2.1 Distribution Network
1.7.7.2.2 Transmission Network
1.7.7.3 Segmentation By Utility Type
1.7.7.3.1 Investor-Owned Utilities (IOUs)
1.7.7.3.2 Municipal Utilities
1.7.7.3.3 Electric Cooperatives
1.7.7.3.4 Industrial / Private Utilities
Chapter 2. Company Profiles
2.1 ABB Ltd.
2.1.1 Company Overview
2.1.2 Company Focus
2.1.3 Strategic Insights
2.1.2 Strategy Deployed
2.1.5 SWOT Analysis
2.1.6 Future Outlook
2.2 Schneider Electric SE
2.2.1 Company Overview
2.2.2 Financial Analysis
2.2.3 Segmental and Regional Analysis
2.2.2 Research & Development Expense
2.2.5 Recent Strategies and Developments
2.2.5.1 Product Launches and Product Expansions
2.2.6 Company Focus
2.2.7 Strategic Insights
2.2.8 Strategy Deployed
2.2.9 SWOT Analysis
2.2.10 Future Outlook
2.3 Siemens AG
2.3.1 Company Overview
2.3.2 Financial Analysis
2.3.3 Segmental and Regional Analysis
2.3.2 Research & Development Expense
2.3.5 Recent Strategies and Developments
2.3.5.1 Partnerships, Collaborations, and Agreements
2.3.5.2 Product Launches and Product Expansions
2.3.6 Company Focus
2.3.7 Strategic Insights
2.3.8 Strategy Deployed
2.3.9 SWOT Analysis
2.3.10 Future Outlook
2.2 Eaton Corporation PLC
2.2.1 Company Overview
2.2.2 Financial Analysis
2.2.3 Segmental and Regional Analysis
2.2.2 Research & Development Expense
2.2.5 Recent Strategies and Developments
2.2.5.1 Partnerships, Collaborations, and Agreements
2.2.6 Company Focus
2.2.7 Strategic Insights
2.2.8 Strategy Deployed
2.2.9 SWOT Analysis
2.2.10 Future Outlook
2.5 GE Vernova Group
2.5.1 Company Overview
2.5.2 Financial Analysis
2.5.3 Segmental and Regional Analysis
2.5.2 Research & Development Expenses
2.5.5 Recent Strategies and Developments
2.5.5.1 Product Launches and Product Expansions
2.5.6 Company Focus
2.5.7 Strategic Insights
2.5.8 Strategy Deployed
2.5.9 SWOT Analysis
2.5.10 Future Outlook
2.6 Landis+Gyr Group AG
2.6.1 Company Overview
2.6.2 Financial Analysis
2.6.3 Regional Analysis
2.6.2 Research and Development Expense
2.6.5 Recent Strategies and Developments
2.6.5.1 Partnerships, Collaborations, and Agreements
2.6.6 Company Focus
2.6.7 Strategic Insights
2.6.8 Strategy Deployed
2.6.9 SWOT Analysis
2.6.10 Future Outlook
2.7 Itron, Inc.
2.7.1 Company Overview
2.7.2 Financial Analysis
2.7.3 Segmental and Regional Analysis
2.7.2 Research & Development Expenses
2.7.5 Recent Strategies and Developments
2.7.5.1 Product Launches and Product Expansions
2.7.6 Company Focus
2.7.7 Strategic Insights
2.7.8 Strategy Deployed
2.7.9 SWOT Analysis
2.7.10 Future Outlook
2.8 S&C Electric Company
2.8.1 Company Overview
2.8.2 Company Focus
2.8.3 Strategic Insights
2.8.2 Strategy Deployed
2.8.5 SWOT Analysis
2.8.6 Future Outlook
2.9 Oracle Corporation
2.9.1 Company Overview
2.9.2 Financial Analysis
2.9.3 Segmental and Regional Analysis
2.9.2 Research & Development Expense
2.9.5 Recent Strategies and Developments
2.9.5.1 Product Launches and Product Expansions
2.9.6 Company Focus
2.9.7 Strategic Insights
2.9.8 Strategy Deployed
2.9.9 SWOT Analysis
2.9.10 Future Outlook
2.1 Hubbell Incorporated (Beckwith Electric)
2.10.1 Company Overview
2.10.2 Financial Analysis
2.10.3 Segmental and Regional Analysis
2.10.2 Research & Development Expenses
2.10.5 Recent Strategies and Developments
2.10.5.1 Product Launches and Product Expansions
2.10.6 Company Focus
2.10.7 Strategic Insights
2.10.8 Strategy Deployed
2.10.9 SWOT Analysis
2.10.10 Future Outlook
Companies Mentioned
- Schneider Electric SE
- Siemens AG
- ABB Ltd.
- Eaton Corporation plc
- General Electric Company
- Mitsubishi Electric Corporation
- Landis+Gyr Group AG
- Open Systems International, Inc.
- S&C Electric Company
- Doble Engineering Company


