



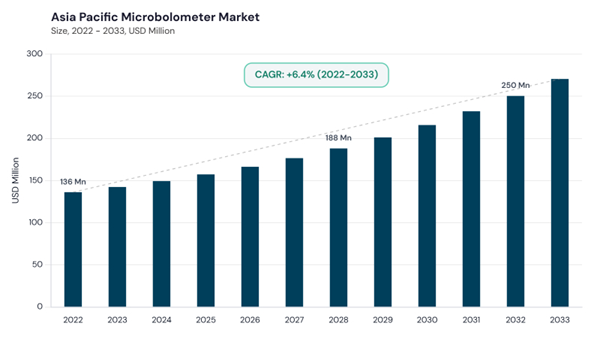
The Asia Pacific Microbolometer Market is forecasted to reach USD 215.84 million by 2030, growing at a CAGR of 7.2% during the forecast period.
The China market dominated the Asia Pacific Microbolometer Market by country in 2025 and is expected to continue to remain dominant till 2033; thereby, achieving a market value of USD 80.1 million by 2033, growing at a CAGR of 5.5% during the forecast period. The Japan market is expected to witness a CAGR of 6.2% during 2026-2033. Additionally, the India market is expected to register a CAGR of 8.1% during the forecast period. China and India accounted for approximately 33.5% and 11.6% share of the regional market respectively in 2025.
The Asia Pacific microbolometer market has evolved rapidly with increasing adoption of infrared imaging technologies across military surveillance, industrial thermography, automotive sensing, healthcare diagnostics, and smart city security applications. Initially driven by defense procurement and border monitoring requirements, the market has progressively expanded into commercial and industrial sectors due to advancements in uncooled infrared detector technologies and declining manufacturing costs. The rapid expansion of industrial automation, predictive maintenance systems, and smart infrastructure development across China, Japan, South Korea, and India has accelerated thermal imaging deployments across multiple industries. Additionally, semiconductor innovation, miniaturization of focal plane arrays, and increasing regional manufacturing capabilities have strengthened the commercialization potential of microbolometer technologies throughout Asia Pacific.
The market is increasingly shaped by AI-enabled thermal analytics, autonomous mobility technologies, and rising integration of thermal sensing systems into connected infrastructure ecosystems. Governments across the region continue investing heavily in defense modernization, public security enhancement, and smart transportation systems, creating sustained demand for high-performance thermal imaging solutions. Automotive manufacturers are integrating thermal sensors into ADAS and autonomous vehicle platforms, while industrial sectors continue deploying thermography systems for equipment monitoring and operational efficiency optimization. Competitive dynamics are centered around sensor sensitivity, high-resolution imaging, compact architectures, and low-power detector technologies. Partnerships between semiconductor manufacturers, thermal imaging companies, and defense contractors are further accelerating technological innovation and regional production capabilities across Asia Pacific.
The 1024 × 768 and Above segment is anticipated to witness the highest CAGR of 7.8% during 2026-2033, while the Below 320 × 240 segment is expected to grow at a CAGR of 7.6%. Increasing demand for high-resolution infrared imaging systems across aerospace targeting, scientific instrumentation, and advanced industrial diagnostics is accelerating adoption of premium-resolution microbolometer systems. Analysis & Future Outlook: Continued advancements in detector sensitivity, compact thermal imaging architectures, and AI-integrated infrared analytics are expected to strengthen long-term demand across both mainstream and advanced resolution categories.
The Other Material segment is expected to witness the highest CAGR of 7.9% during 2026-2033, followed by Amorphous Silicon (a-Si) at 7.7%. Ongoing advancements in semiconductor fabrication technologies, enhanced infrared absorption materials, and low-power sensor architectures are driving growth across alternative detector material technologies. Analysis & Future Outlook: Increasing R&D investments in next-generation thermal detector materials and scalable semiconductor manufacturing processes are expected to intensify innovation across the Asia Pacific microbolometer ecosystem.
The Other Application segment is anticipated to witness the highest CAGR of 11.1% during 2026-2033, followed by Consumer Electronics at 10.4% and Healthcare at 8.6%. Growing integration of thermal sensing technologies into smart consumer devices, wearable electronics, IoT-enabled monitoring platforms, and healthcare diagnostics is accelerating adoption across emerging commercial applications. Analysis & Future Outlook: Expanding deployment of AI-powered thermal analytics, connected sensing systems, and smart infrastructure technologies is expected to create significant long-term opportunities across both enterprise and consumer application segments.
Additionally, rapid expansion of autonomous mobility technologies, intelligent surveillance infrastructure, and industrial predictive maintenance systems is strengthening long-term market demand across China. The country also benefits from significant collaboration between semiconductor firms, imaging technology developers, defense organizations, and AI solution providers focused on advancing detector sensitivity, thermal analytics, and compact imaging architectures. Future market growth is expected to be supported by increasing investments in defense electronics, industrial digitalization, smart transportation infrastructure, and next-generation infrared sensing technologies.
The China market dominated the Asia Pacific Microbolometer Market by country in 2025 and is expected to continue to remain dominant till 2033; thereby, achieving a market value of USD 80.1 million by 2033, growing at a CAGR of 5.5% during the forecast period. The Japan market is expected to witness a CAGR of 6.2% during 2026-2033. Additionally, the India market is expected to register a CAGR of 8.1% during the forecast period. China and India accounted for approximately 33.5% and 11.6% share of the regional market respectively in 2025.
The Asia Pacific microbolometer market has evolved rapidly with increasing adoption of infrared imaging technologies across military surveillance, industrial thermography, automotive sensing, healthcare diagnostics, and smart city security applications. Initially driven by defense procurement and border monitoring requirements, the market has progressively expanded into commercial and industrial sectors due to advancements in uncooled infrared detector technologies and declining manufacturing costs. The rapid expansion of industrial automation, predictive maintenance systems, and smart infrastructure development across China, Japan, South Korea, and India has accelerated thermal imaging deployments across multiple industries. Additionally, semiconductor innovation, miniaturization of focal plane arrays, and increasing regional manufacturing capabilities have strengthened the commercialization potential of microbolometer technologies throughout Asia Pacific.
The market is increasingly shaped by AI-enabled thermal analytics, autonomous mobility technologies, and rising integration of thermal sensing systems into connected infrastructure ecosystems. Governments across the region continue investing heavily in defense modernization, public security enhancement, and smart transportation systems, creating sustained demand for high-performance thermal imaging solutions. Automotive manufacturers are integrating thermal sensors into ADAS and autonomous vehicle platforms, while industrial sectors continue deploying thermography systems for equipment monitoring and operational efficiency optimization. Competitive dynamics are centered around sensor sensitivity, high-resolution imaging, compact architectures, and low-power detector technologies. Partnerships between semiconductor manufacturers, thermal imaging companies, and defense contractors are further accelerating technological innovation and regional production capabilities across Asia Pacific.
Resolution Outlook
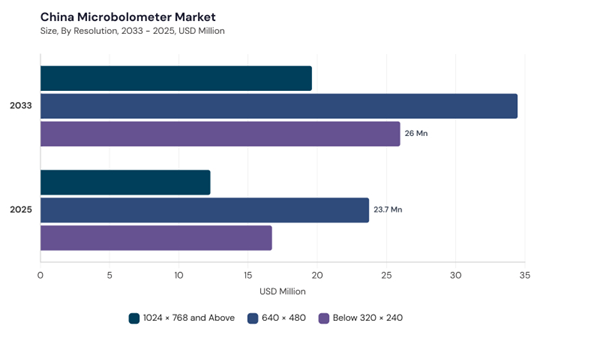
Based on Resolution, the market is segmented into 640 × 480, Below 320 × 240, and 1024 × 768 and Above. The 640 × 480 segment dominated the Asia Pacific Microbolometer Market by Resolution in 2025 and is expected to continue to remain dominant till 2033; thereby, achieving a market value of USD 117.1 million by 2033, growing at a CAGR of 6.6% during the forecast period. The dominance of this segment is supported by its balanced performance, cost efficiency, and broad deployment across industrial monitoring, defense surveillance, and automotive thermal imaging applications.The 1024 × 768 and Above segment is anticipated to witness the highest CAGR of 7.8% during 2026-2033, while the Below 320 × 240 segment is expected to grow at a CAGR of 7.6%. Increasing demand for high-resolution infrared imaging systems across aerospace targeting, scientific instrumentation, and advanced industrial diagnostics is accelerating adoption of premium-resolution microbolometer systems. Analysis & Future Outlook: Continued advancements in detector sensitivity, compact thermal imaging architectures, and AI-integrated infrared analytics are expected to strengthen long-term demand across both mainstream and advanced resolution categories.
Material Outlook
Based on Material, the market is segmented into Vanadium Oxide (VOx), Amorphous Silicon (a-Si), and Other Material. The Vanadium Oxide (VOx) segment dominated the Asia Pacific Microbolometer Market by Material in 2025 and is expected to continue to remain dominant till 2033; thereby, achieving a market value of USD 140.4 million by 2033, growing at a CAGR of 6.7% during the forecast period. The segment continues to maintain leadership due to superior thermal sensitivity, stable detector performance, and widespread integration across military-grade and industrial thermal imaging systems.The Other Material segment is expected to witness the highest CAGR of 7.9% during 2026-2033, followed by Amorphous Silicon (a-Si) at 7.7%. Ongoing advancements in semiconductor fabrication technologies, enhanced infrared absorption materials, and low-power sensor architectures are driving growth across alternative detector material technologies. Analysis & Future Outlook: Increasing R&D investments in next-generation thermal detector materials and scalable semiconductor manufacturing processes are expected to intensify innovation across the Asia Pacific microbolometer ecosystem.
Application Outlook
Based on Application, the market is segmented into Aerospace & Defense, Security & Surveillance, Automotive, Industrial (Monitoring & Thermography), Healthcare, Consumer Electronics, and Other Application. The Aerospace & Defense segment dominated the Asia Pacific Microbolometer Market by Application in 2025 and is expected to continue to remain dominant till 2033; thereby, achieving a market value of USD 90.7 million by 2033, growing at a CAGR of 6.4% during the forecast period. Rising defense spending, border surveillance initiatives, and increasing deployment of UAV-integrated thermal imaging systems continue supporting segment expansion across the region.The Other Application segment is anticipated to witness the highest CAGR of 11.1% during 2026-2033, followed by Consumer Electronics at 10.4% and Healthcare at 8.6%. Growing integration of thermal sensing technologies into smart consumer devices, wearable electronics, IoT-enabled monitoring platforms, and healthcare diagnostics is accelerating adoption across emerging commercial applications. Analysis & Future Outlook: Expanding deployment of AI-powered thermal analytics, connected sensing systems, and smart infrastructure technologies is expected to create significant long-term opportunities across both enterprise and consumer application segments.
Country Outlook
China represents the largest and most influential microbolometer market across Asia Pacific, supported by strong semiconductor manufacturing capabilities, expanding defense modernization initiatives, and rapidly growing industrial automation infrastructure. The country continues to witness substantial adoption of thermal imaging systems across public security, industrial thermography, aerospace surveillance, automotive safety systems, and smart city deployments. China’s large-scale electronics manufacturing ecosystem and increasing investments in infrared sensing technologies are accelerating commercialization and cost optimization across thermal imaging applications.Additionally, rapid expansion of autonomous mobility technologies, intelligent surveillance infrastructure, and industrial predictive maintenance systems is strengthening long-term market demand across China. The country also benefits from significant collaboration between semiconductor firms, imaging technology developers, defense organizations, and AI solution providers focused on advancing detector sensitivity, thermal analytics, and compact imaging architectures. Future market growth is expected to be supported by increasing investments in defense electronics, industrial digitalization, smart transportation infrastructure, and next-generation infrared sensing technologies.
List of Key Companies Profiled
- Teledyne Technologies Incorporated
- Lynred
- Leonardo DRS, Inc.
- RTX Corporation
- L3Harris Technologies, Inc.
- Zhejiang Dali Technology Co., Ltd.
- Guide Sensmart
- Hamamatsu Photonics K.K.
- NEC Corporation
- InfraTec GmbH
Market Report Segmentation
By Resolution- 640 × 480
- Below 320 × 240
- 1024 × 768 and Above
- Vanadium Oxide (VOx)
- Amorphous Silicon (a-Si)
- Other Material
- Aerospace & Defense
- Security & Surveillance
- Automotive
- Industrial (Monitoring & Thermography)
- Healthcare
- Consumer Electronics
- Other Application
- China
- Japan
- India
- South Korea
- Singapore
- Malaysia
- Rest of Asia Pacific
Table of Contents
Chapter 1. Asia Pacific Market1.1 Market Overview
1.2 Key Factors Impacting Market
1.2.1 Market Drivers
1.2.2 Market Restraints
1.2.3 Market Opportunities
1.2.4 Market Challenges
1.2.5 Market Trends
1.2.6 State of Competition
1.2.7 Market Consolidation
1.2.8 Key Customer Criteria
1.3 Product Life Cycle
1.4 Segmentation By Resolution
1.4.1 Below 320 × 240
1.4.2 640 × 480
1.4.3 1024 × 768 and Above
1.5 Segmentation By Material
1.5.1 Vanadium Oxide (VOx)
1.5.2 Amorphous Silicon (a-Si)
1.5.3 Other Material
1.6 Segmentation By Application
1.6.1 Aerospace & Defense
1.6.2 Security & Surveillance
1.6.3 Automotive
1.6.4 Industrial (Monitoring & Thermography)
1.6.5 Healthcare
1.6.6 Consumer Electronics
1.6.7 Other Application
1.7 Segmentation By Country
1.7.1 China
1.7.1.1 Segmentation By Resolution
1.7.1.1.1 Below 320 × 240
1.7.1.1.2 640 × 480
1.7.1.1.3 1024 × 768 and Above
1.7.1.2 Segmentation By Material
1.7.1.2.1 Vanadium Oxide (VOx)
1.7.1.2.2 Amorphous Silicon (a-Si)
1.7.1.2.3 Other Material
1.7.1.3 Segmentation By Application
1.7.1.3.1 Aerospace & Defense
1.7.1.3.2 Security & Surveillance
1.7.1.3.3 Automotive
1.7.1.3.4 Industrial (Monitoring & Thermography)
1.7.1.3.5 Healthcare
1.7.1.3.6 Consumer Electronics
1.7.1.3.7 Other Application
1.7.2 Japan
1.7.2.1 Segmentation By Resolution
1.7.2.1.1 Below 320 × 240
1.7.2.1.2 640 × 480
1.7.2.1.3 1024 × 768 and Above
1.7.2.2 Segmentation By Material
1.7.2.2.1 Vanadium Oxide (VOx)
1.7.2.2.2 Amorphous Silicon (a-Si)
1.7.2.2.3 Other Material
1.7.2.3 Segmentation By Application
1.7.2.3.1 Aerospace & Defense
1.7.2.3.2 Security & Surveillance
1.7.2.3.3 Automotive
1.7.2.3.4 Industrial (Monitoring & Thermography)
1.7.2.3.5 Healthcare
1.7.2.3.6 Consumer Electronics
1.7.2.3.7 Other Application
1.7.3 India
1.7.3.1 Segmentation By Resolution
1.7.3.1.1 Below 320 × 240
1.7.3.1.2 640 × 480
1.7.3.1.3 1024 × 768 and Above
1.7.3.2 Segmentation By Material
1.7.3.2.1 Vanadium Oxide (VOx)
1.7.3.2.2 Amorphous Silicon (a-Si)
1.7.3.2.3 Other Material
1.7.3.3 Segmentation By Application
1.7.3.3.1 Aerospace & Defense
1.7.3.3.2 Security & Surveillance
1.7.3.3.3 Automotive
1.7.3.3.4 Industrial (Monitoring & Thermography)
1.7.3.3.5 Healthcare
1.7.3.3.6 Consumer Electronics
1.7.3.3.7 Other Application
1.7.4 South Korea
1.7.4.1 Segmentation By Resolution
1.7.4.1.1 Below 320 × 240
1.7.4.1.2 640 × 480
1.7.4.1.3 1024 × 768 and Above
1.7.4.2 Segmentation By Material
1.7.4.2.1 Vanadium Oxide (VOx)
1.7.4.2.2 Amorphous Silicon (a-Si)
1.7.4.2.3 Other Material
1.7.4.3 Segmentation By Application
1.7.4.3.1 Aerospace & Defense
1.7.4.3.2 Security & Surveillance
1.7.4.3.3 Automotive
1.7.4.3.4 Industrial (Monitoring & Thermography)
1.7.4.3.5 Healthcare
1.7.4.3.6 Consumer Electronics
1.7.4.3.7 Other Application
1.7.5 Singapore
1.7.5.1 Segmentation By Resolution
1.7.5.1.1 Below 320 × 240
1.7.5.1.2 640 × 480
1.7.5.1.3 1024 × 768 and Above
1.7.5.2 Segmentation By Material
1.7.5.2.1 Vanadium Oxide (VOx)
1.7.5.2.2 Amorphous Silicon (a-Si)
1.7.5.2.3 Other Material
1.7.5.3 Segmentation By Application
1.7.5.3.1 Aerospace & Defense
1.7.5.3.2 Security & Surveillance
1.7.5.3.3 Automotive
1.7.5.3.4 Industrial (Monitoring & Thermography)
1.7.5.3.5 Healthcare
1.7.5.3.6 Consumer Electronics
1.7.5.3.7 Other Application
1.7.6 Malaysia
1.7.6.1 Segmentation By Resolution
1.7.6.1.1 Below 320 × 240
1.7.6.1.2 640 × 480
1.7.6.1.3 1024 × 768 and Above
1.7.6.2 Segmentation By Material
1.7.6.2.1 Vanadium Oxide (VOx)
1.7.6.2.2 Amorphous Silicon (a-Si)
1.7.6.2.3 Other Material
1.7.6.3 Segmentation By Application
1.7.6.3.1 Aerospace & Defense
1.7.6.3.2 Security & Surveillance
1.7.6.3.3 Automotive
1.7.6.3.4 Industrial (Monitoring & Thermography)
1.7.6.3.5 Healthcare
1.7.6.3.6 Consumer Electronics
1.7.6.3.7 Other Application
1.7.7 Rest of Asia Pacific
1.7.7.1 Segmentation By Resolution
1.7.7.1.1 Below 320 × 240
1.7.7.1.2 640 × 480
1.7.7.1.3 1024 × 768 and Above
1.7.7.2 Segmentation By Material
1.7.7.2.1 Vanadium Oxide (VOx)
1.7.7.2.2 Amorphous Silicon (a-Si)
1.7.7.2.3 Other Material
1.7.7.3 Segmentation By Application
1.7.7.3.1 Aerospace & Defense
1.7.7.3.2 Security & Surveillance
1.7.7.3.3 Automotive
1.7.7.3.4 Industrial (Monitoring & Thermography)
1.7.7.3.5 Healthcare
1.7.7.3.6 Consumer Electronics
1.7.7.3.7 Other Application
Chapter 2. Company Snapshot
2.1 Teledyne Technologies Incorporated
2.1.1 Business Overview
2.1.2 Key Information
2.1.3 Company Focus
2.1.4 Strategic Insights
2.1.5 Strategy Deployed
2.1.6 Product & Service Portfolio
2.1.7 Capability Overview
2.1.8 Technology & Innovation Focus
2.1.9 Customers / End Users
2.1.10 Competitive Positioning
2.1.11 Key Differentiators
2.1.12 Portfolio Matrix
2.1.13 SWOT Analysis
2.1.14 Future Outlook
2.2 Lynred
2.2.1 Business Overview
2.2.2 Key Information
2.2.3 Company Focus
2.2.4 Strategic Insights
2.2.5 Strategy Deployed
2.2.6 Product & Service Portfolio
2.2.7 Capability Overview
2.2.8 Technology & Innovation Focus
2.2.9 Customers / End Users
2.2.10 Competitive Positioning
2.2.11 Key Differentiators
2.2.12 Portfolio Matrix
2.2.13 SWOT Analysis
2.2.14 Future Outlook
2.3 Leonardo SpA (Leonardo DRS, Inc.)
2.3.1 Business Overview
2.3.2 Key Information
2.3.3 Company Focus
2.3.4 Strategic Insights
2.3.5 Strategy Deployed
2.3.6 Product & Service Portfolio
2.3.7 Capability Overview
2.3.8 Technology & Innovation Focus
2.3.9 Customers / End Users
2.3.10 Competitive Positioning
2.3.11 Key Differentiators
2.3.12 Portfolio Matrix
2.3.13 SWOT Analysis
2.3.14 Future Outlook
2.4 RTX Corporation
2.4.1 Business Overview
2.4.2 Key Information
2.4.3 Company Focus
2.4.4 Strategic Insights
2.4.5 Strategy Deployed
2.4.6 Product & Service Portfolio
2.4.7 Capability Overview
2.4.8 Technology & Innovation Focus
2.4.9 Customers / End Users
2.4.10 Competitive Positioning
2.4.11 Key Differentiators
2.4.12 Portfolio Matrix
2.4.13 SWOT Analysis
2.4.14 Future Outlook
2.5 L3Harris Technologies, Inc.
2.5.1 Business Overview
2.5.2 Key Information
2.5.3 Company Focus
2.5.4 Strategic Insights
2.5.5 Strategy Deployed
2.5.6 Product & Service Portfolio
2.5.7 Capability Overview
2.5.8 Technology & Innovation Focus
2.5.9 Customers / End Users
2.5.10 Competitive Positioning
2.5.11 Key Differentiators
2.5.12 Portfolio Matrix
2.5.13 SWOT Analysis
2.5.14 Future Outlook
2.6 NEC Corporation
2.6.1 Business Overview
2.6.2 Key Information
2.6.3 Company Focus
2.6.4 Strategic Insights
2.6.5 Strategy Deployed
2.6.6 Product & Service Portfolio
2.6.7 Capability Overview
2.6.8 Technology & Innovation Focus
2.6.9 Customers / End Users
2.6.10 Competitive Positioning
2.6.11 Key Differentiators
2.6.12 Portfolio Matrix
2.6.13 SWOT Analysis
2.6.14 Future Outlook
2.7 Zhejiang Dali Technology Co., Ltd.
2.7.1 Business Overview
2.7.2 Key Information
2.7.3 Company Focus
2.7.4 Strategic Insights
2.7.5 Strategy Deployed
2.7.6 Product & Service Portfolio
2.7.7 Capability Overview
2.7.8 Technology & Innovation Focus
2.7.9 Customers / End Users
2.7.10 Competitive Positioning
2.7.11 Key Differentiators
2.7.12 Portfolio Matrix
2.7.13 SWOT Analysis
2.7.14 Future Outlook
2.8 Guide Sensmart Tech Co., Ltd.
2.8.1 Business Overview
2.8.2 Key Information
2.8.3 Company Focus
2.8.4 Strategic Insights
2.8.5 Strategy Deployed
2.8.6 Product & Service Portfolio
2.8.7 Capability Overview
2.8.8 Technology & Innovation Focus
2.8.9 Customers / End Users
2.8.10 Competitive Positioning
2.8.11 Key Differentiators
2.8.12 Portfolio Matrix
2.8.13 SWOT Analysis
2.8.14 Future Outlook
2.9 Hamamatsu Photonics K.K.
2.9.1 Business Overview
2.9.2 Key Information
2.9.3 Company Focus
2.9.4 Strategic Insights
2.9.5 Strategy Deployed
2.9.6 Product & Service Portfolio
2.9.7 Capability Overview
2.9.8 Technology & Innovation Focus
2.9.9 Customers / End Users
2.9.10 Competitive Positioning
2.9.11 Key Differentiators
2.9.12 Portfolio Matrix
2.9.13 SWOT Analysis
2.9.14 Future Outlook
2.10 InfraTec GmbH
2.10.1 Business Overview
2.10.2 Key Information
2.10.3 Company Focus
2.10.4 Strategic Insights
2.10.5 Strategy Deployed
2.10.6 Product & Service Portfolio
2.10.7 Capability Overview
2.10.8 Technology & Innovation Focus
2.10.9 Customers / End Users
2.10.10 Competitive Positioning
2.10.11 Key Differentiators
2.10.12 Portfolio Matrix
2.10.13 SWOT Analysis
2.10.14 Future Outlook
Companies Mentioned
- Teledyne Technologies Incorporated
- Lynred
- Leonardo DRS, Inc.
- RTX Corporation
- L3Harris Technologies, Inc.
- Zhejiang Dali Technology Co., Ltd.
- Guide Sensmart
- Hamamatsu Photonics K.K.
- NEC Corporation
- InfraTec GmbH


